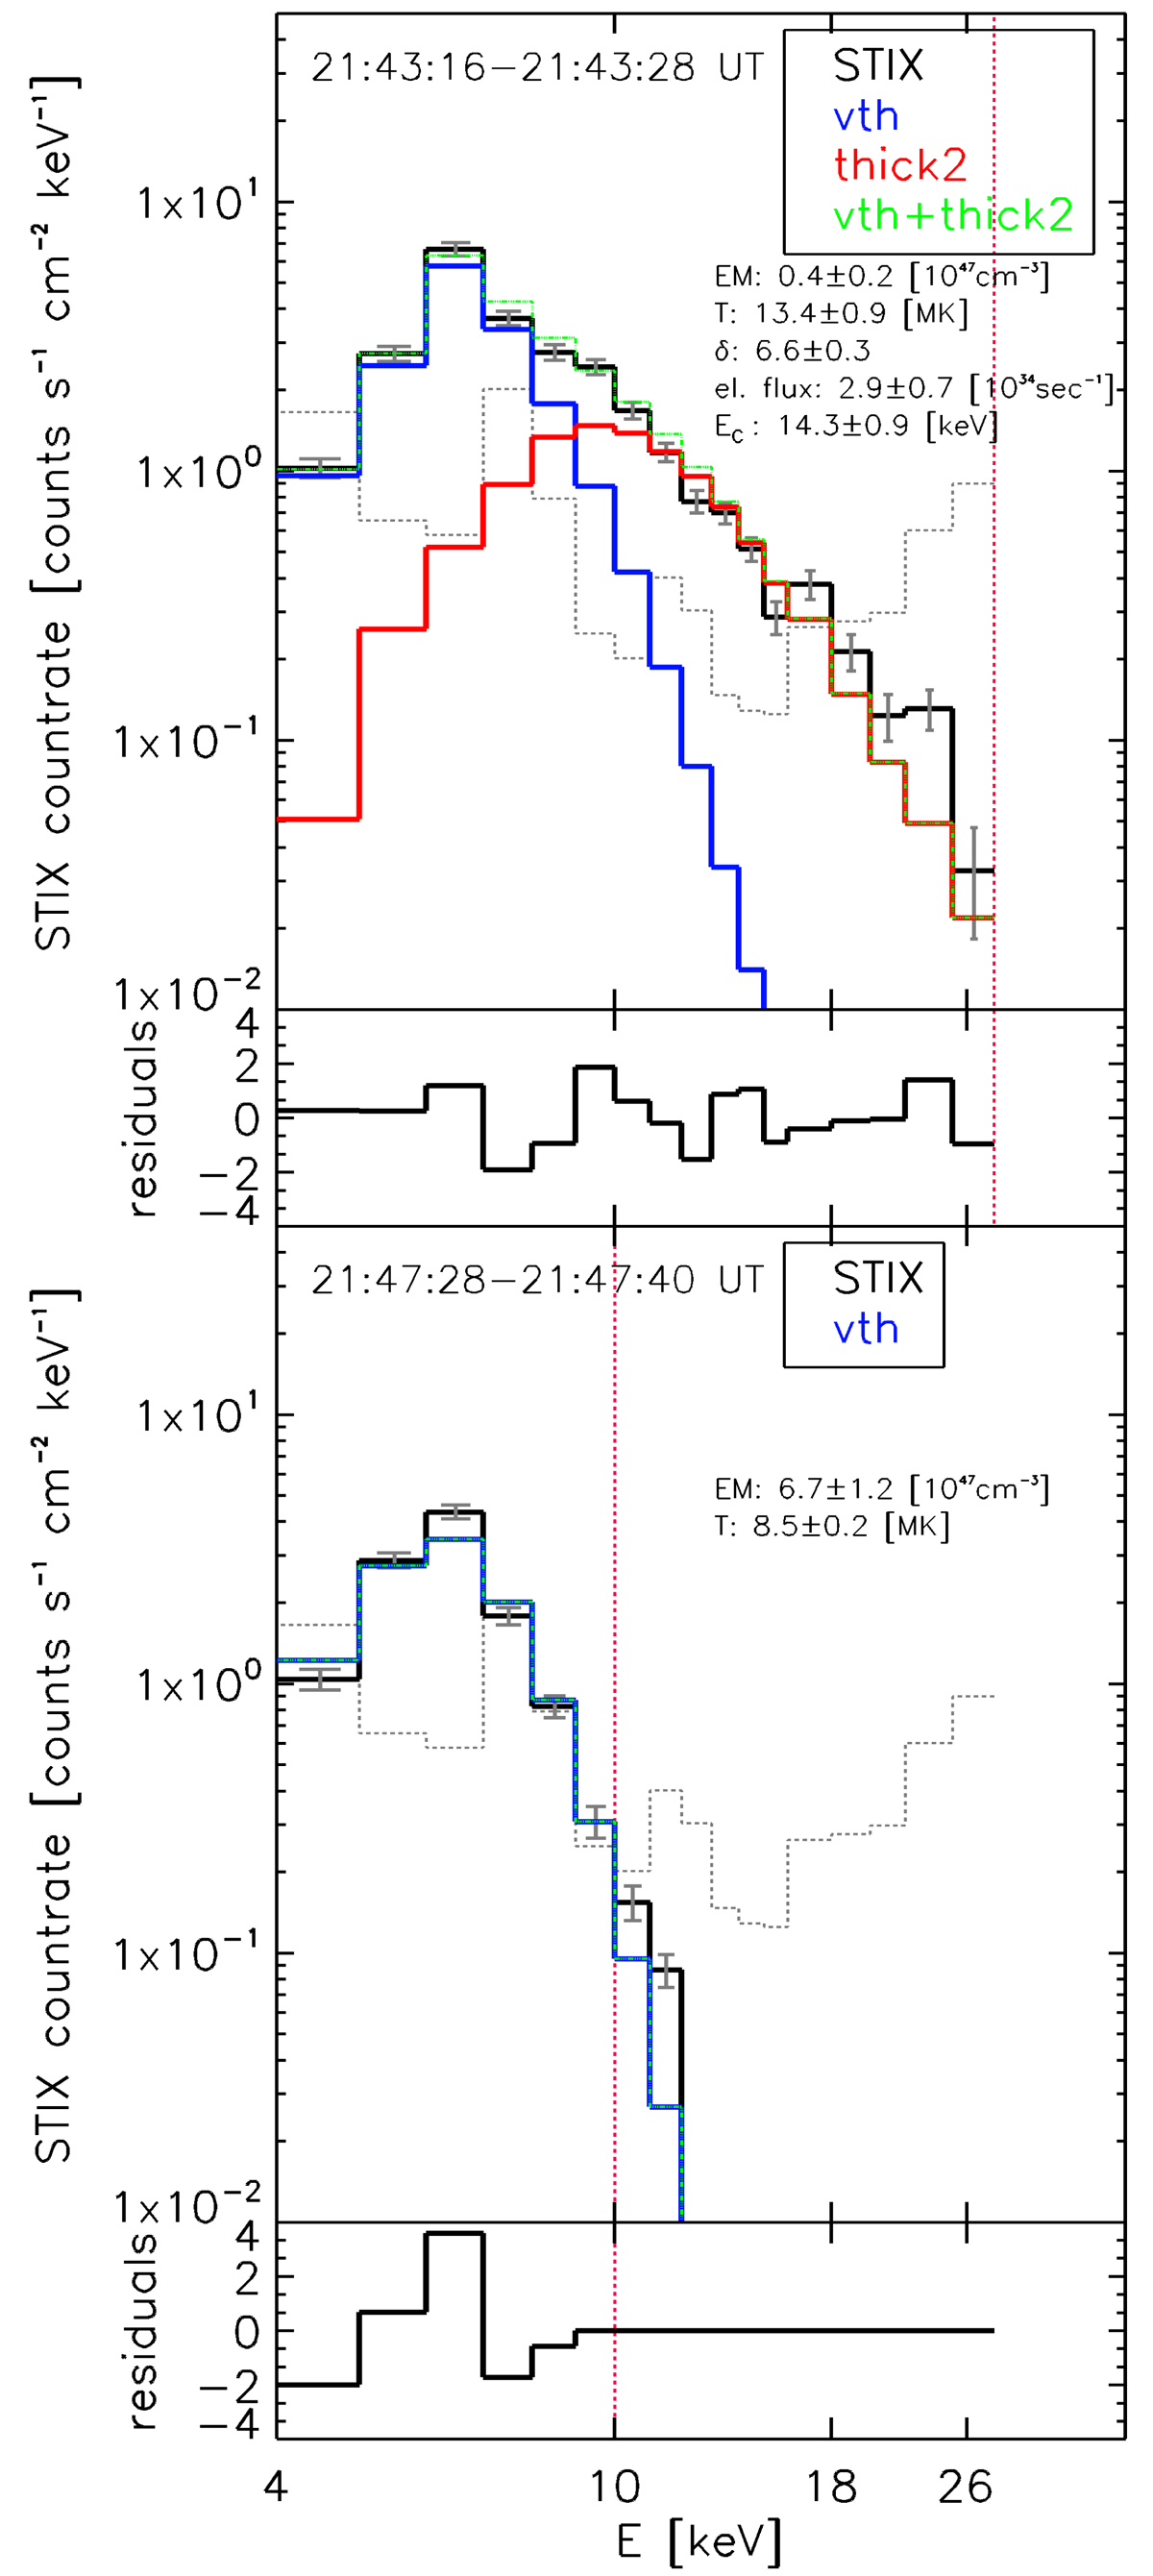
Fig. 4.
Download original image
STIX X-ray spectra for the B6 event on 7 June 2020, during the impulsive phase (top panel) and gradual phase (bottom panel). Black: Background-subtracted data. Blue: Isothermal fit. Red: Thick target fit. Green: Sum of isothermal and thick target emission. Grey: Preflare background. Red vertical lines indicate the energy range used for fitting (4–28 and 4–10 keV, respectively).
Current usage metrics show cumulative count of Article Views (full-text article views including HTML views, PDF and ePub downloads, according to the available data) and Abstracts Views on Vision4Press platform.
Data correspond to usage on the plateform after 2015. The current usage metrics is available 48-96 hours after online publication and is updated daily on week days.
Initial download of the metrics may take a while.