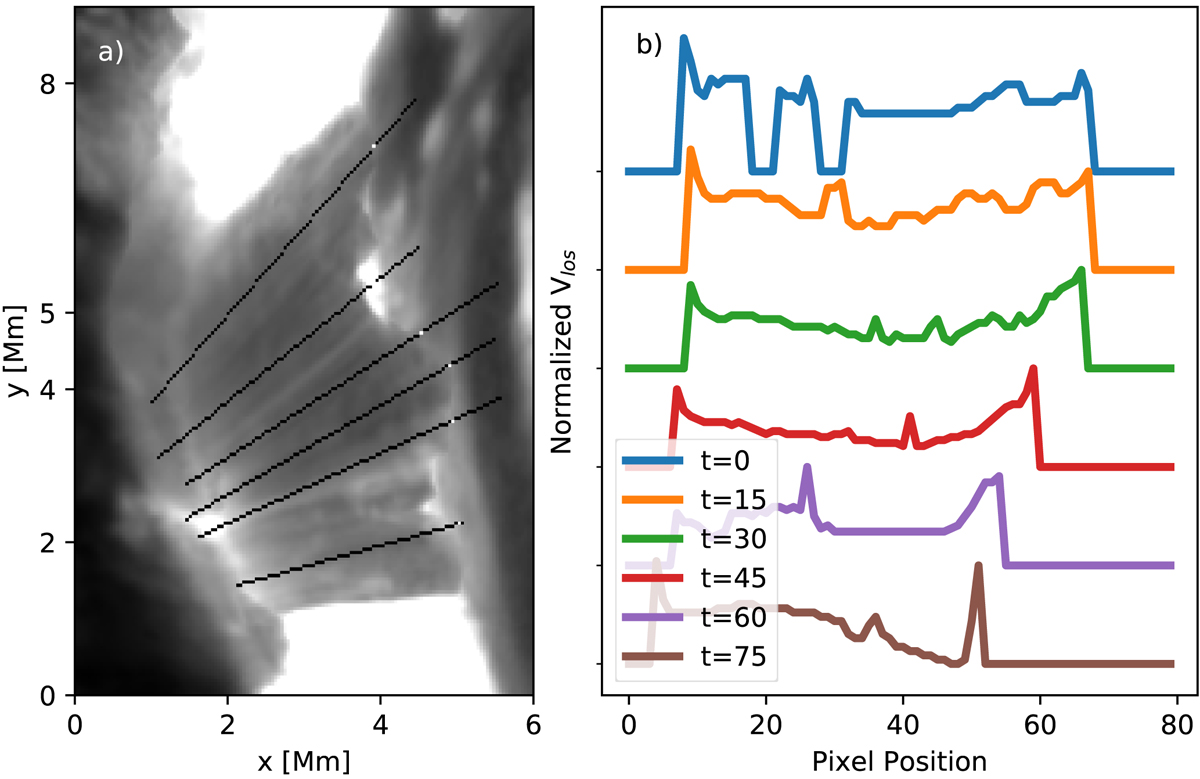
Fig. 6.
Download original image
Collapse of the fan tracked along six spines. Panel a: minimum value of the Hα emission intensity. This shows the fan in the first time frame (11:59:20 UT). The six spines used are shown using black lines, with a white dot denoting the edge of the fan as derived from the process shown in panel b. Panel b: LOS velocity values on the y-axis (normalized to the same maximum value for comparison) against position along the length of the spine in pixels on the x-axis (zero being the base of the spine). This data is shown at six different times (in different colors) for the fourth spine from the top.
Current usage metrics show cumulative count of Article Views (full-text article views including HTML views, PDF and ePub downloads, according to the available data) and Abstracts Views on Vision4Press platform.
Data correspond to usage on the plateform after 2015. The current usage metrics is available 48-96 hours after online publication and is updated daily on week days.
Initial download of the metrics may take a while.