Fig. 5.
Download original image
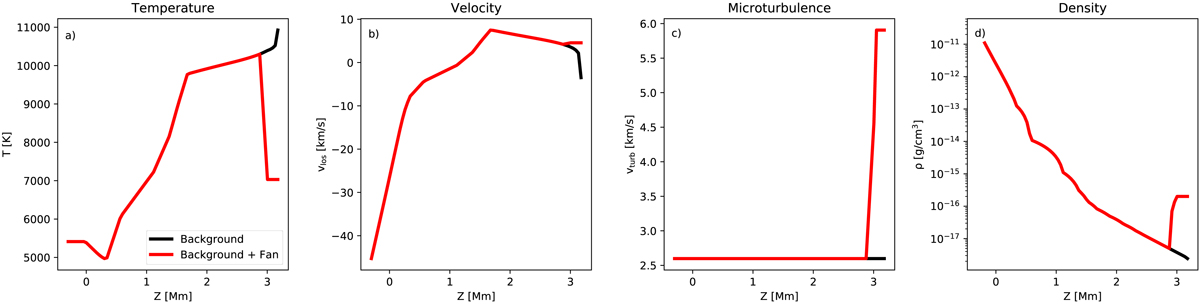
Stratification in geometrical height scale of parameters (T, vlos, vturb) inverted with our second cloud model (described in Sect. 3.2) as well as the inferred density from the first cloud model (described in Sect. 3.1). The black line shows the stratification of these parameters for the flare ribbon background, while the red line compares these same parameters for the best fit of an inverted pixel inside of the fan. Note that the model stratification is fixed everywhere except in the slab at the top of the atmosphere. Panel a: temperature; panel b: LOS velocity; panel c: microtubulence; and panel d: density. The observed and best-fit profiles belonging to these atmospheres can be found in Fig. 8c.
Current usage metrics show cumulative count of Article Views (full-text article views including HTML views, PDF and ePub downloads, according to the available data) and Abstracts Views on Vision4Press platform.
Data correspond to usage on the plateform after 2015. The current usage metrics is available 48-96 hours after online publication and is updated daily on week days.
Initial download of the metrics may take a while.