Fig. 4.
Download original image
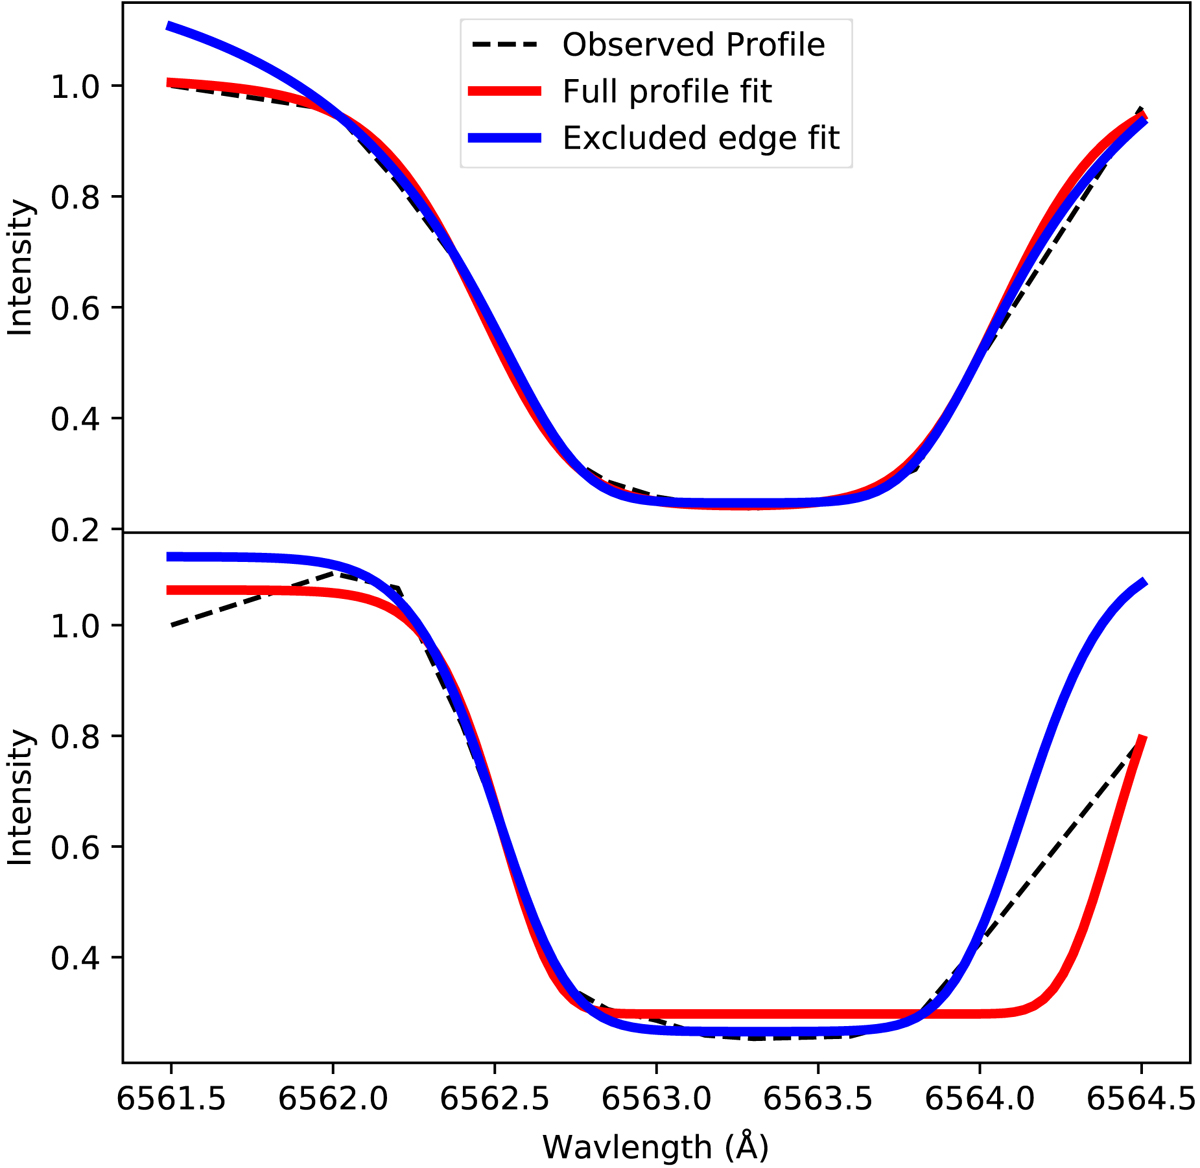
Plot of examples of Hα profiles from pixels containing the fan jet (black) and the fit using the BCM including (red) and excluding (blue) the two outermost wavelength points. Top: fitted profile with a low χ2, showing good agreement between the blue and red curves. Bottom: profile with asymmetrical far wings that caused a high χ2 value in the original fit, and a much better fit to the main component shown by the blue curve.
Current usage metrics show cumulative count of Article Views (full-text article views including HTML views, PDF and ePub downloads, according to the available data) and Abstracts Views on Vision4Press platform.
Data correspond to usage on the plateform after 2015. The current usage metrics is available 48-96 hours after online publication and is updated daily on week days.
Initial download of the metrics may take a while.