Fig. 1.
Download original image
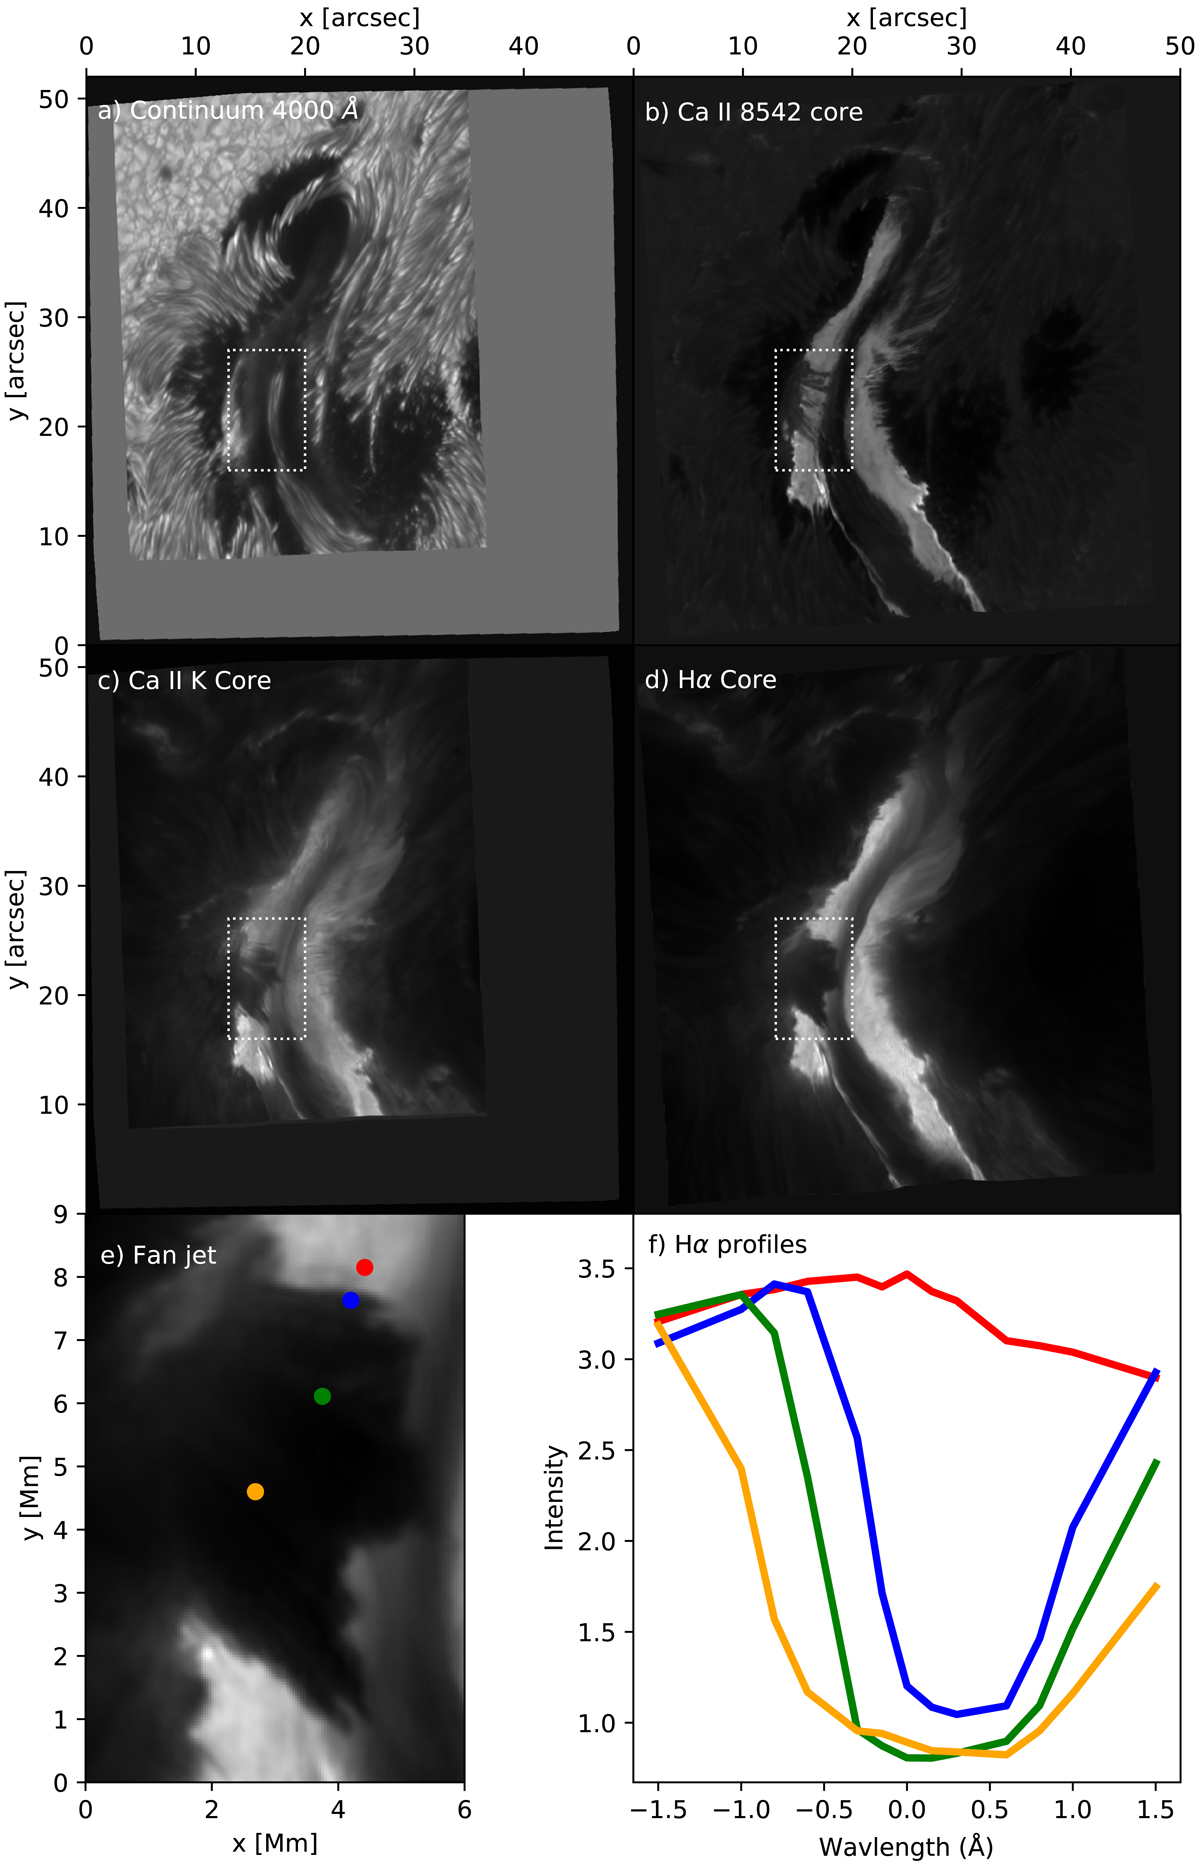
Overview of AR 12673 taken on 6 September 2017 at 11:59 UT. The fan jet is indicated by a white rectangle. Panel a: continuum intensity 4000 Å; b: Ca II 8542 Å line core intensity; c: Ca II K line core intensity; d: Hα line core intensity; e: enlarged view of white rectangle in panel d. The red, blue, green, and orange dots show the physical locations from which the profiles shown in panel f were taken; f: Hα profiles of flare ribbon (red) and fan jet (blue, green, yellow).
Current usage metrics show cumulative count of Article Views (full-text article views including HTML views, PDF and ePub downloads, according to the available data) and Abstracts Views on Vision4Press platform.
Data correspond to usage on the plateform after 2015. The current usage metrics is available 48-96 hours after online publication and is updated daily on week days.
Initial download of the metrics may take a while.