Fig. A.2
Download original image
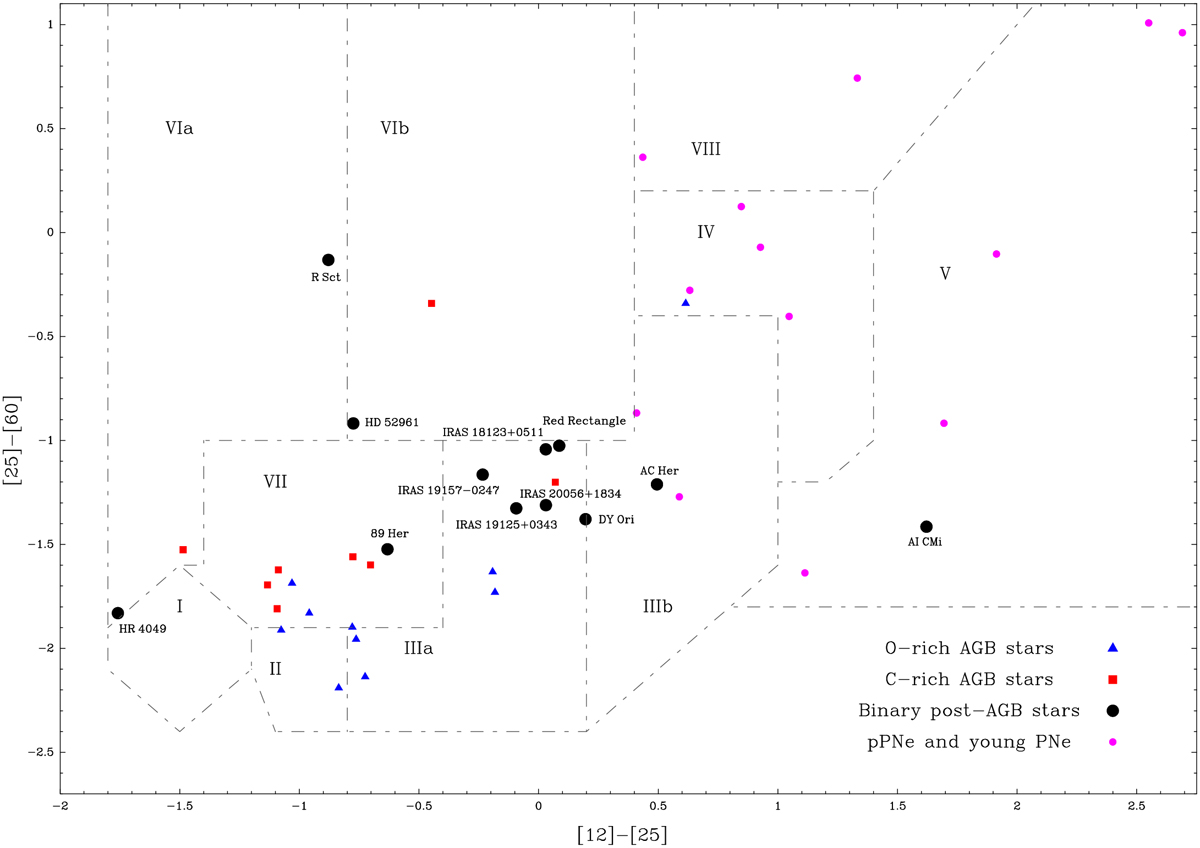
Diagram of [25]–[60] vs. [12]–[25] IRAS colors. The IRAS color-color diagram is divided in different regions where sources with similar characteristics are located (see van der Veen & Habing 1988, for details). Standard AGB stars are represented with blue triangles (O-rich) and red squares (C-rich), pre-planetary and young planetary nebulae are represented with purple circles and the binary post-AGB stars of this work are shown with black circles.
Current usage metrics show cumulative count of Article Views (full-text article views including HTML views, PDF and ePub downloads, according to the available data) and Abstracts Views on Vision4Press platform.
Data correspond to usage on the plateform after 2015. The current usage metrics is available 48-96 hours after online publication and is updated daily on week days.
Initial download of the metrics may take a while.