Free Access
Fig. 9
Download original image
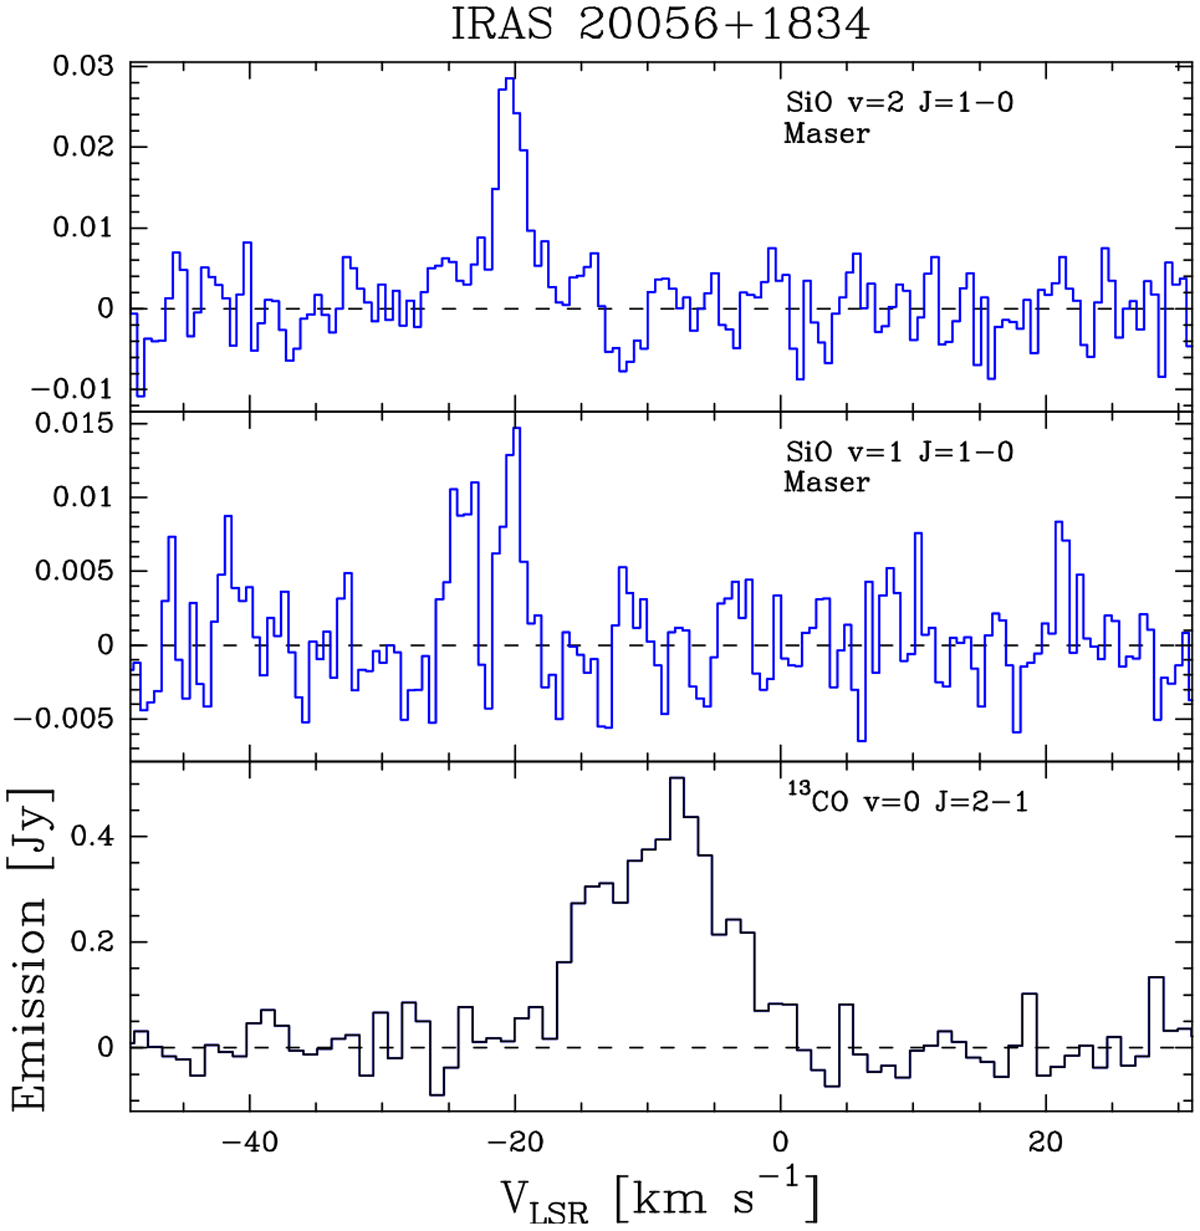
Spectra of the newly maser detections in IRAS 20056+1834. For comparison purposes, we also show the 13CO J = 2–1 line in black (Bujarrabal et al. 2013a). The x-axis indicates velocity with respect to the local standard of rest (VLSR) and the y-axis represents the detected flux measured in Jansky.
Current usage metrics show cumulative count of Article Views (full-text article views including HTML views, PDF and ePub downloads, according to the available data) and Abstracts Views on Vision4Press platform.
Data correspond to usage on the plateform after 2015. The current usage metrics is available 48-96 hours after online publication and is updated daily on week days.
Initial download of the metrics may take a while.