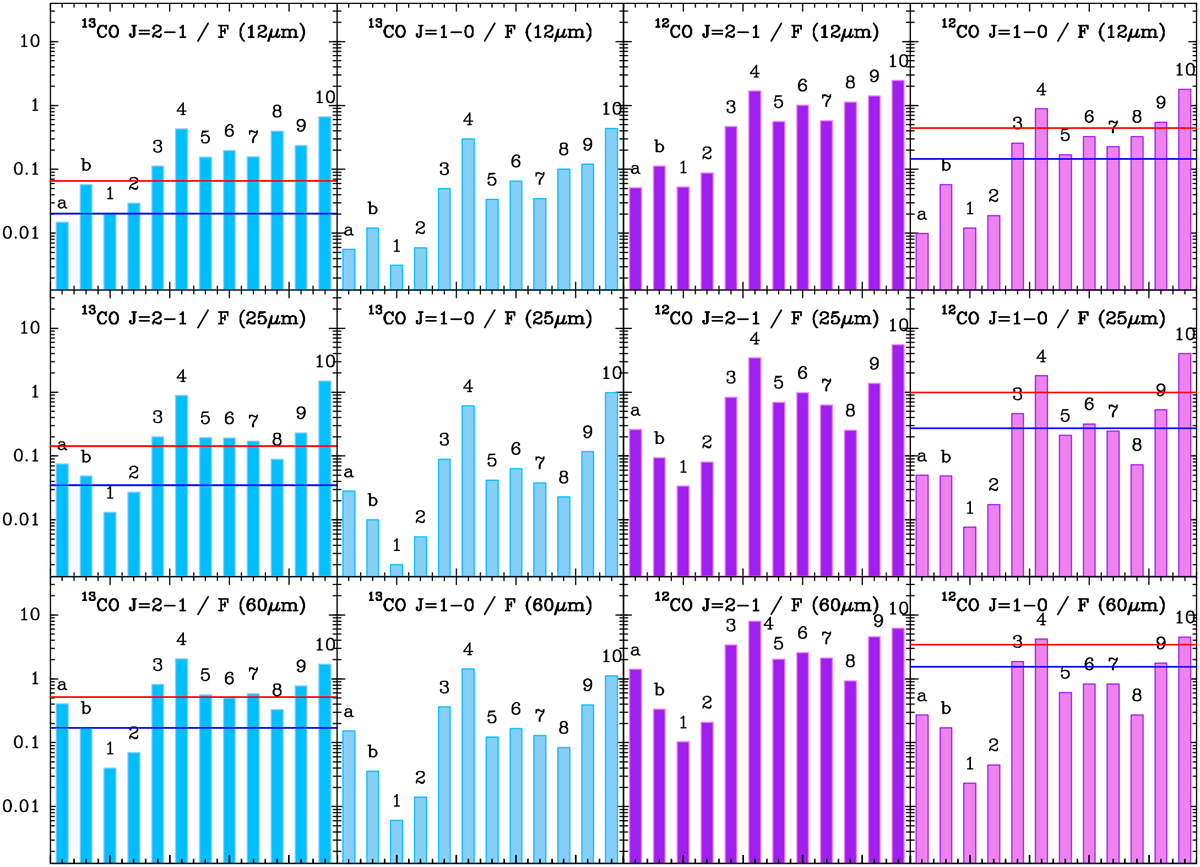
Fig. 14
Download original image
Ratios of integrated intensities of 12CO (blue) and 13CO (purple) J = 2–1 and J = 1–0 and infrared emission (12, 25, and 60 μm) in binary post-AGB stars. Blue and red lines represent the averaged values for O- and C-rich AGB CSEs. Sources are are ordered by increasing outflow dominance and enumerated as follows: a – HR 4049, b – DY Ori, 1 – AC Her, 2 – Red Rectangle, 3 – 89 Her, 4 – HD 52961, 5 – IRAS 19157–0257, 6 – IRAS 18123+0511, 7 – IRAS 19125+0343, 8 – AI CMi, 9 – IRAS 20056+1834, and 10 – R Sct. Souces a and b are not included in this mm-wave survey. Sources 1, 2, a, and b are disk-dominated binary post-AGB stars, sources 6 to 10 are outflow-dominated, and sources 3, 4, and 5 are intermediate cases. We note the broad range (on a logarithmic scale) of intensity ratios. We find uncertainties less than ~10% in these ratios, which are basically dominated by that of the integrated intensity of CO (see Bujarrabal et al. 2013a).
Current usage metrics show cumulative count of Article Views (full-text article views including HTML views, PDF and ePub downloads, according to the available data) and Abstracts Views on Vision4Press platform.
Data correspond to usage on the plateform after 2015. The current usage metrics is available 48-96 hours after online publication and is updated daily on week days.
Initial download of the metrics may take a while.