Fig. 1
Download original image
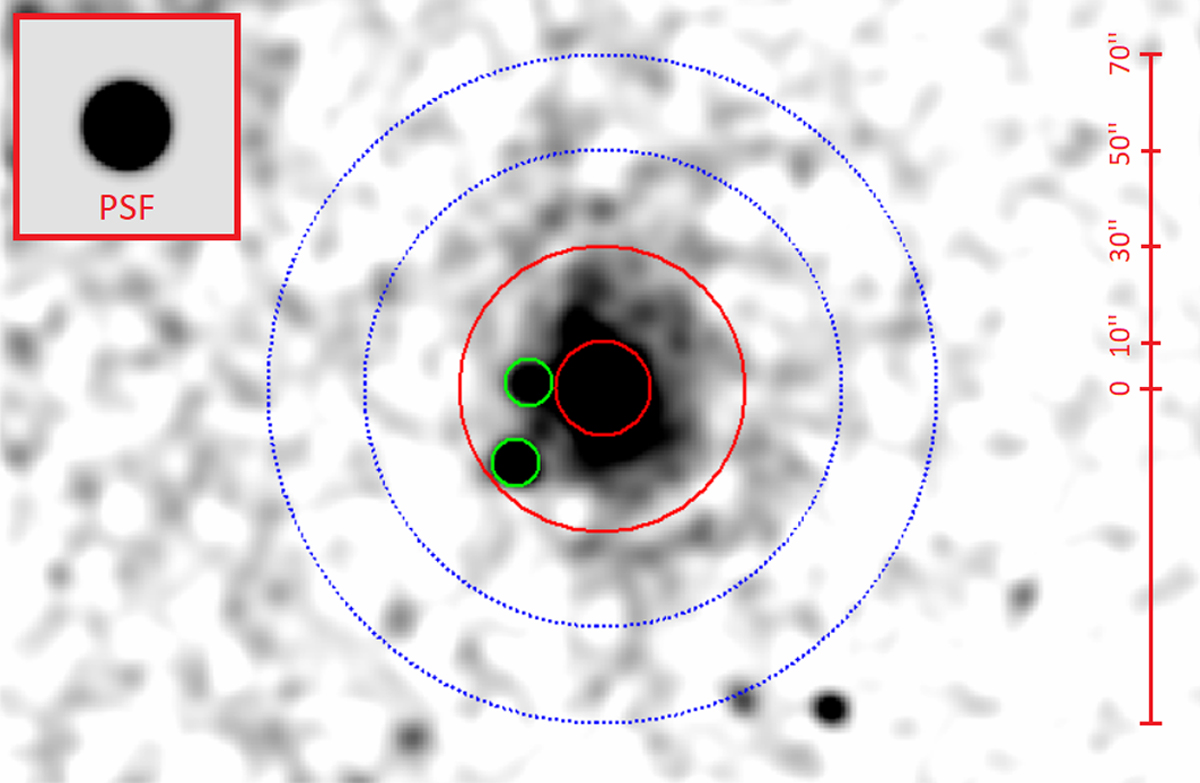
Adaptively smoothed count image (derived from Chandra data) around the CCO showing the brightest part of the halo, with the simulated PSF (scaled accordingly) on top left. Additionally, the image is smoothed with a 5′′ kernel (which corresponds to the size of the small green circles denoting two point sources excluded from the analysis) to enhance the visual appearance. The red and blue annuli denote the source and background regions that were used to extract the halo spectrum, respectively. Within the source region, the contribution of the CCO is negligible, as also illustrated in Fig. 3.
Current usage metrics show cumulative count of Article Views (full-text article views including HTML views, PDF and ePub downloads, according to the available data) and Abstracts Views on Vision4Press platform.
Data correspond to usage on the plateform after 2015. The current usage metrics is available 48-96 hours after online publication and is updated daily on week days.
Initial download of the metrics may take a while.