Fig. 1.
Download original image
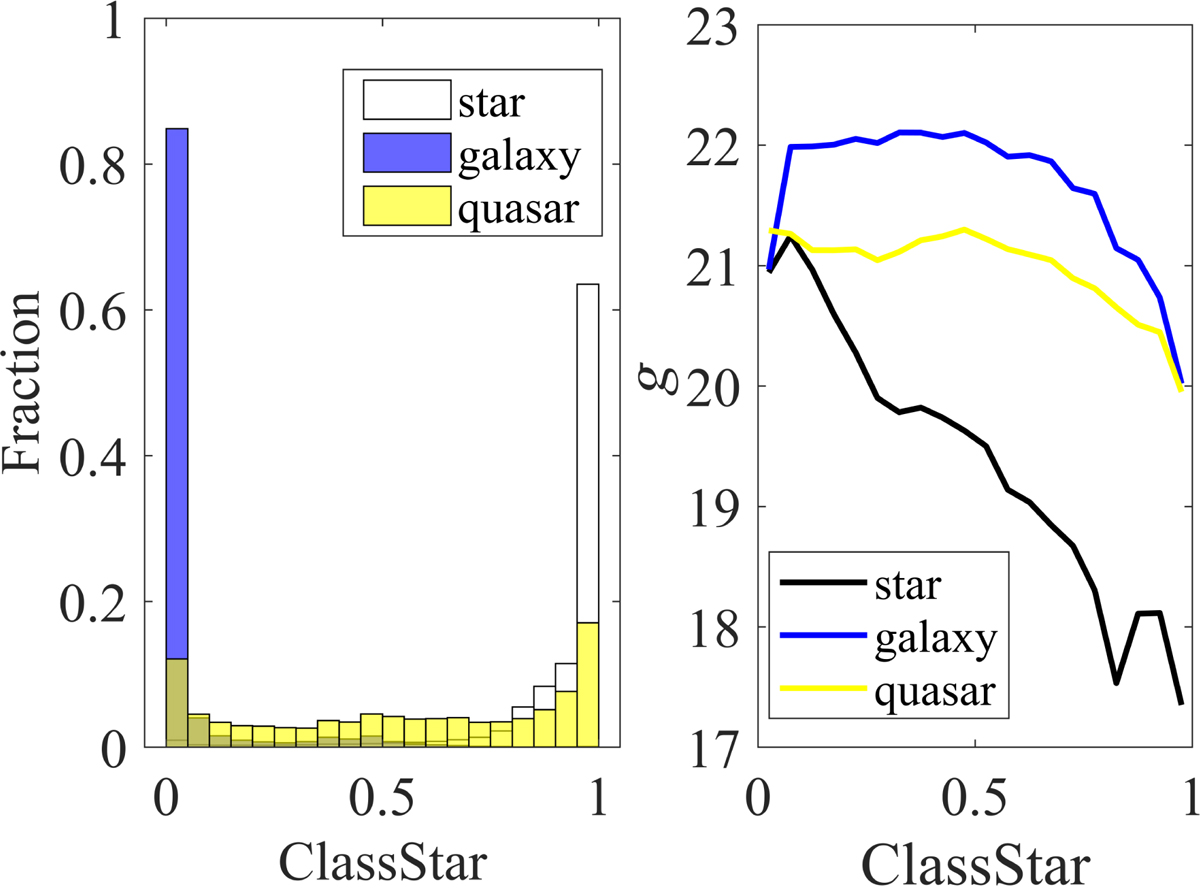
Comparison between the class in the sample set and the J-PLUS “CLASS_STAR” parameter. The panel on the left-hand side shows the normalized distributions of CLASS_STAR. The panel on the right-hand side shows the relation between the average magnitudes in the g band corresponding to each bin (the left panel) of CLASS_STAR. The white box and black line denote denotes the stellar objects, blue stands for the galaxies, and yellow is for the QSOs.
Current usage metrics show cumulative count of Article Views (full-text article views including HTML views, PDF and ePub downloads, according to the available data) and Abstracts Views on Vision4Press platform.
Data correspond to usage on the plateform after 2015. The current usage metrics is available 48-96 hours after online publication and is updated daily on week days.
Initial download of the metrics may take a while.