Free Access
Fig. 2.
Download original image
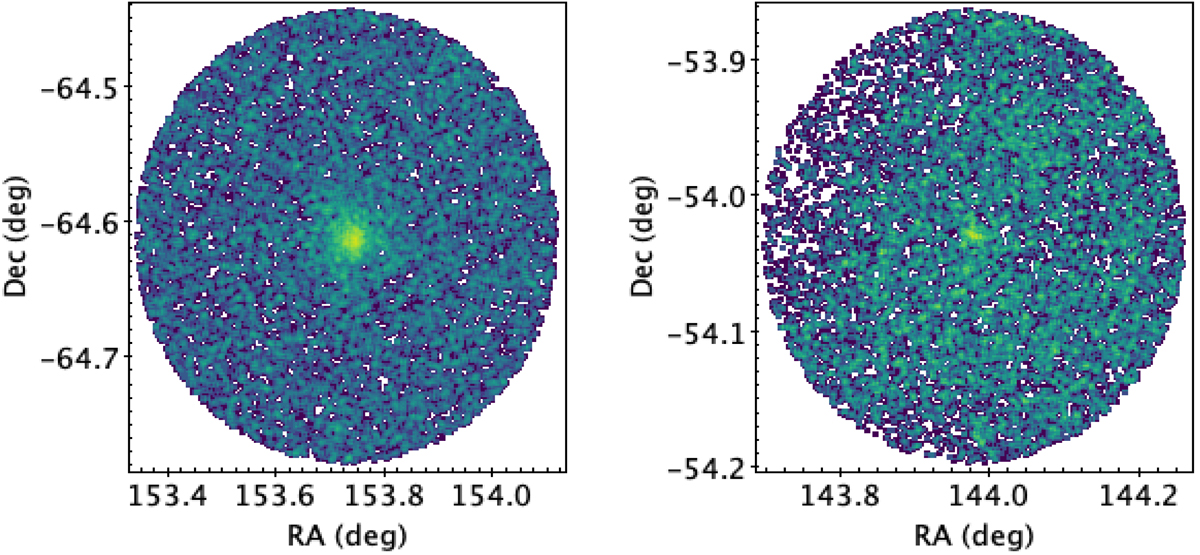
Gaia EDR3 density maps, cleaned from nearby stars, centred on the ESO 92-18 (left) and Kronberger 100 (right) fields. These two clusters are used to visually show the different target sizes. The greener areas are higher densities, while the bluer areas are lower densities.
Current usage metrics show cumulative count of Article Views (full-text article views including HTML views, PDF and ePub downloads, according to the available data) and Abstracts Views on Vision4Press platform.
Data correspond to usage on the plateform after 2015. The current usage metrics is available 48-96 hours after online publication and is updated daily on week days.
Initial download of the metrics may take a while.