Fig. 10.
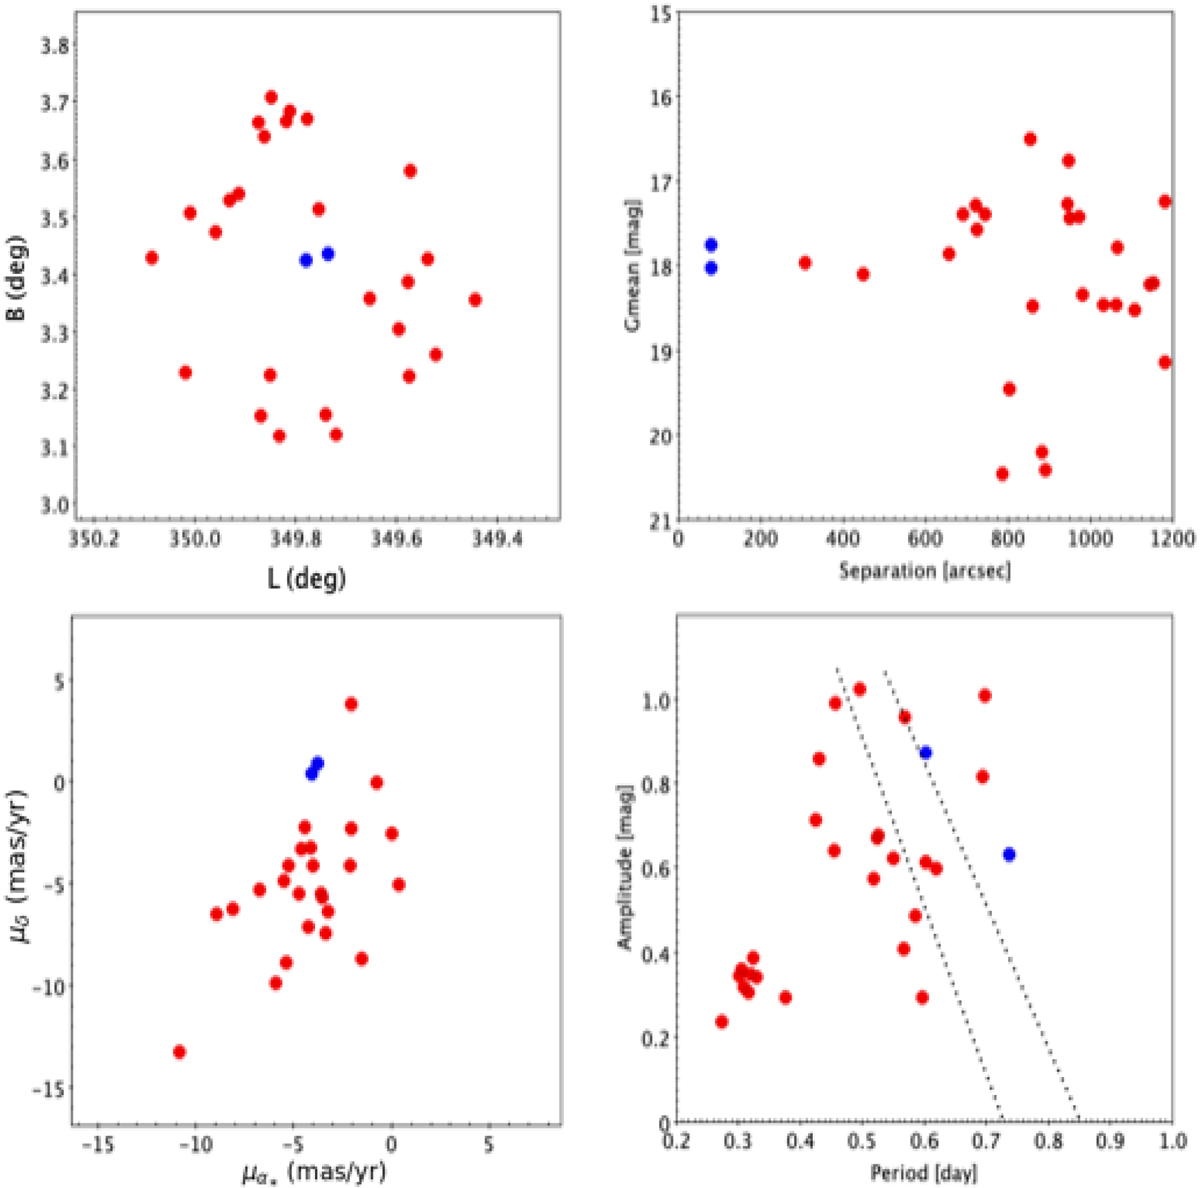
Download original image
Position (top left panel), magnitude-separation (top right panel), Gaia EDR3 PM-distribution (bottom left panel), and period-amplitude (bottom right panel) diagrams for the RR Lyrae stars located within 20′ from the centre of the cluster Patchick 125. The mean ridge lines for the Oosterhoff type I and II populations (left and right dotted lines, respectively) are from Clement & Shelton (1999). The two RR Lyrae members are shown as blue points.
Current usage metrics show cumulative count of Article Views (full-text article views including HTML views, PDF and ePub downloads, according to the available data) and Abstracts Views on Vision4Press platform.
Data correspond to usage on the plateform after 2015. The current usage metrics is available 48-96 hours after online publication and is updated daily on week days.
Initial download of the metrics may take a while.