Fig. 3.
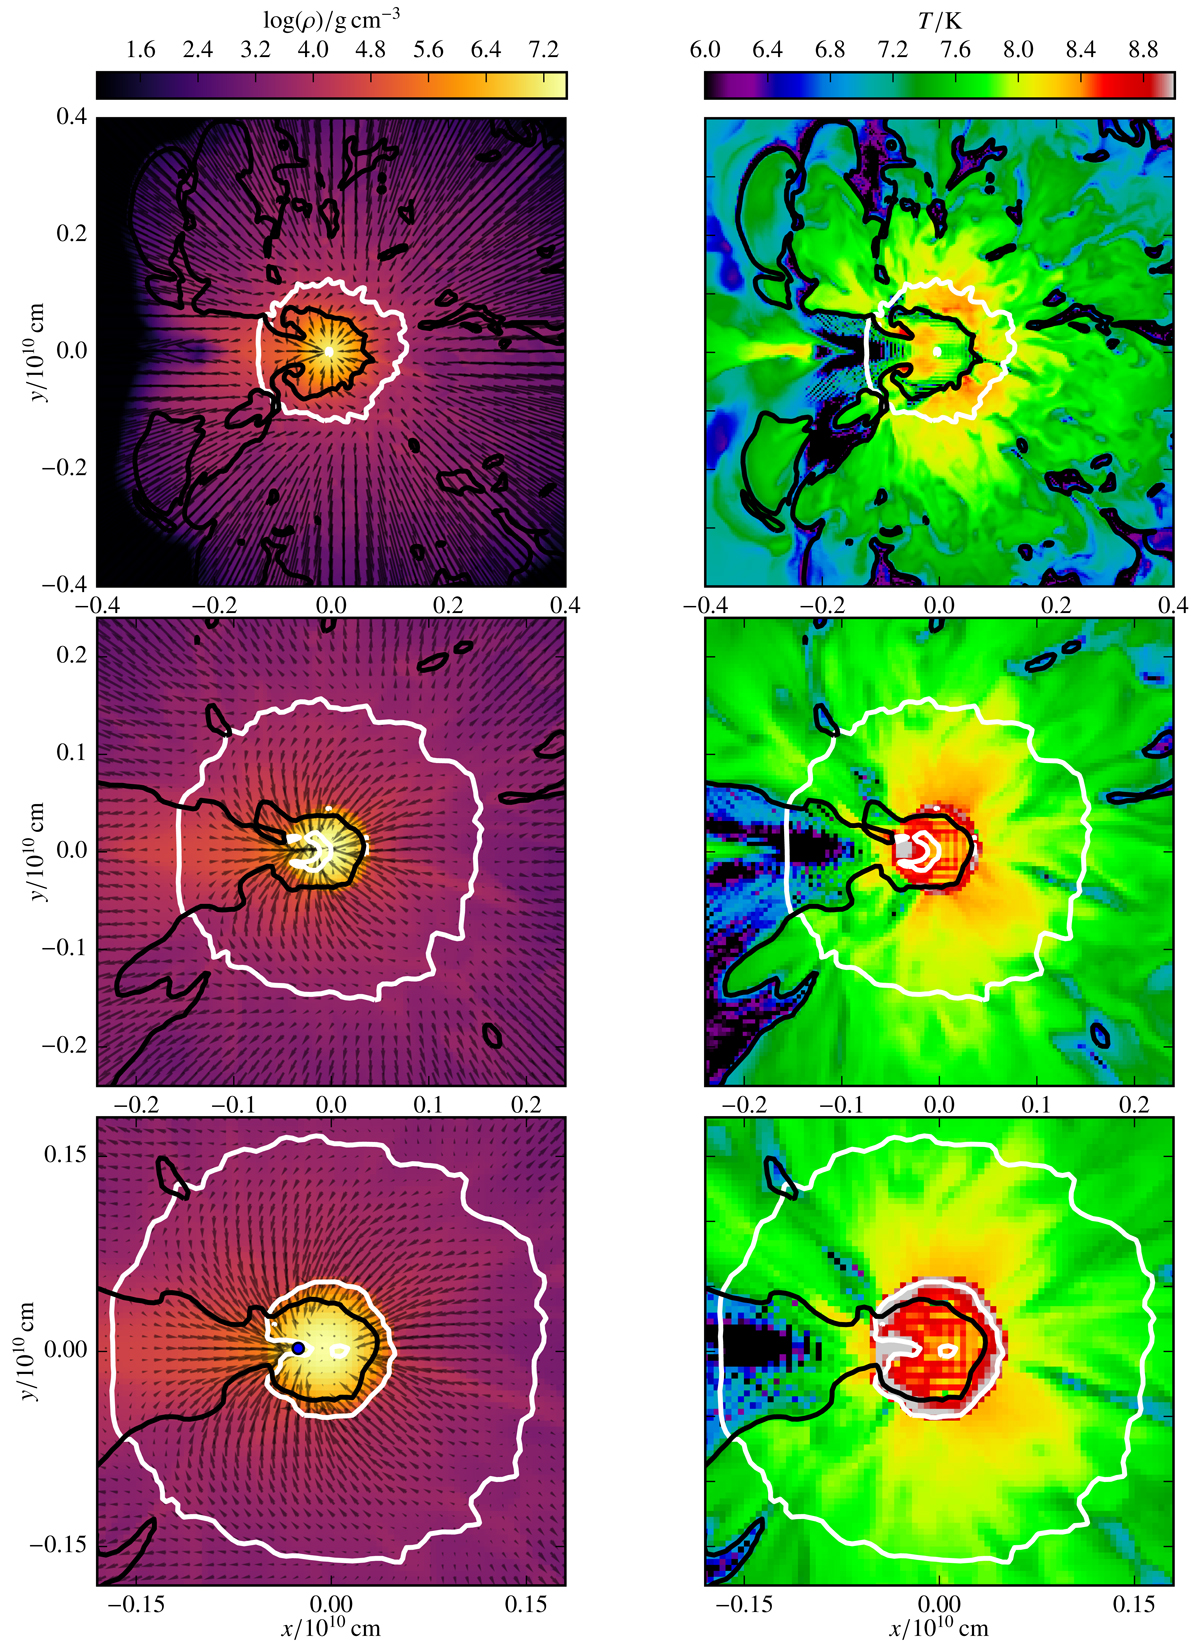
Download original image
Slices of the x − y-plane at z = 0 showing the density (left column) and the temperature (right column) of Model r10_d2.6 for three points in time: 6.21 s, 7.71 s and 8.31 s (from top to bottom). The white contour marks the zero level of the radial velocity, i.e., it separates regions of expansion and contraction and the black contour indicates X(CO) = 0.8. The blue point in the bottom left panel shows the location of the detonation initiation.
Current usage metrics show cumulative count of Article Views (full-text article views including HTML views, PDF and ePub downloads, according to the available data) and Abstracts Views on Vision4Press platform.
Data correspond to usage on the plateform after 2015. The current usage metrics is available 48-96 hours after online publication and is updated daily on week days.
Initial download of the metrics may take a while.