Fig. 1.
Download original image
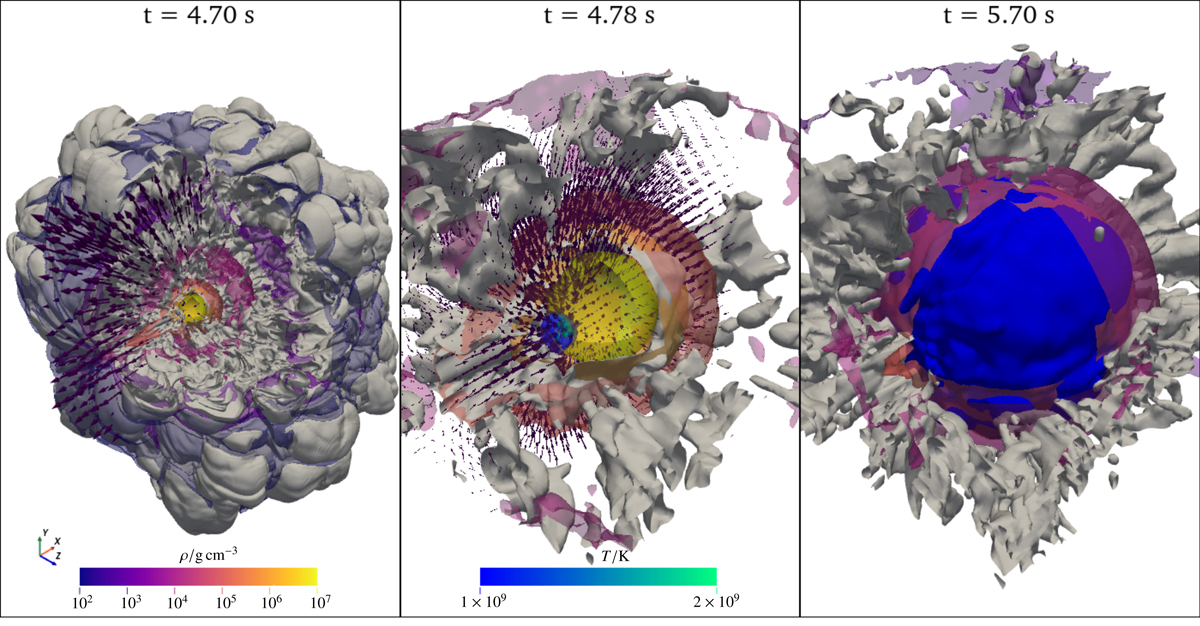
Flame surface (gray) and density isosurfaces of ρ = 102, 103, 104, 105, 106, 107 g cm−3 (see colorbar) for model r60_d2.6. Left panel: situation prior to detonation initiation at t = 4.7 s. Middle panel: zoom in on the core at t = 4.78 s. The hotspot with temperatures above 1 × 10⁹ K is marked by the blue-green contour. Right panel: detonation front (blue surface) ∼1 s after initiation. The illustration is not to scale.
Current usage metrics show cumulative count of Article Views (full-text article views including HTML views, PDF and ePub downloads, according to the available data) and Abstracts Views on Vision4Press platform.
Data correspond to usage on the plateform after 2015. The current usage metrics is available 48-96 hours after online publication and is updated daily on week days.
Initial download of the metrics may take a while.