Fig. 8
Download original image
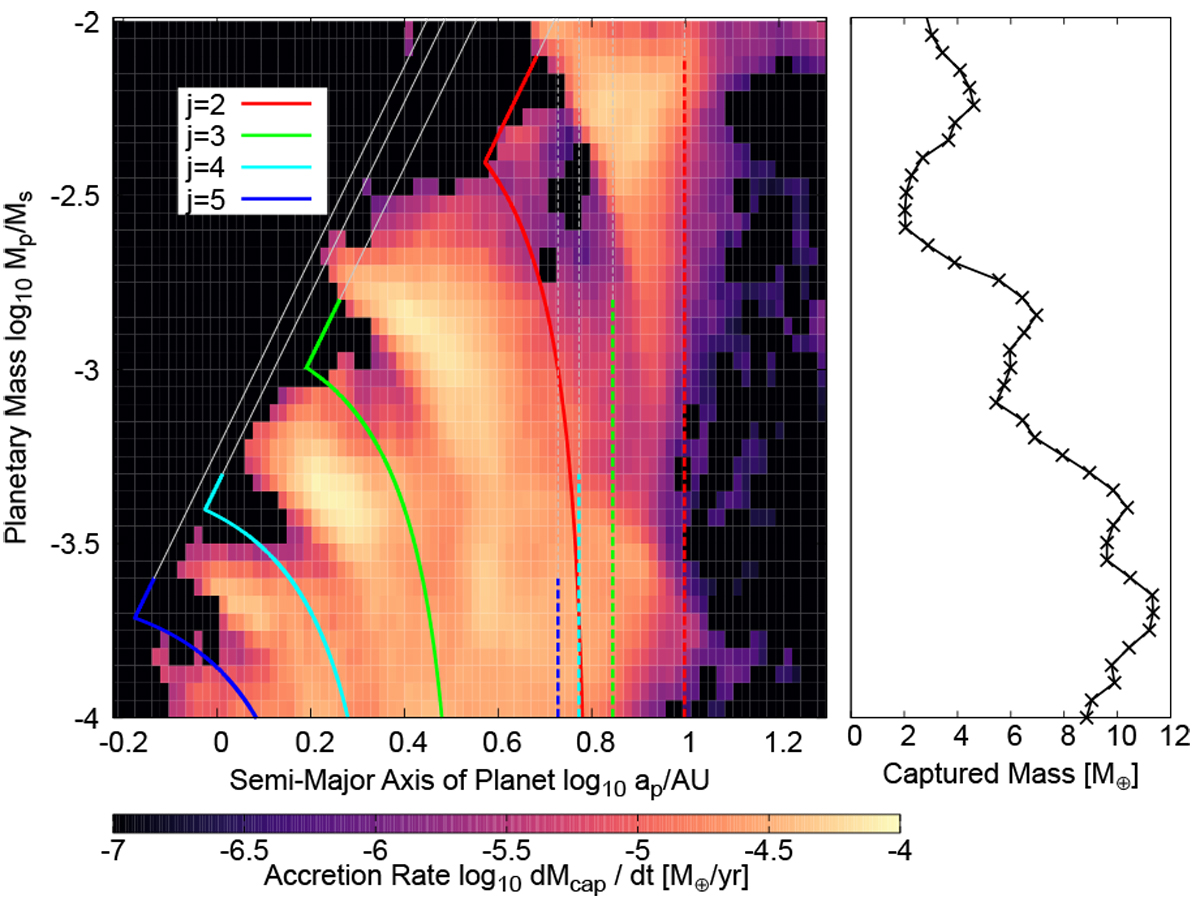
Same as Fig. 5, but for the results of the parameter study when varying the protoplanet’s mass, Mp. The red, green, sky blue, and blue lines represent the SSP inner (solid lines) and outer (dashed lines) boundaries determined by the resonant trapping, which is predicted by Eq. (32) for j = 2, 3, 4, and 5, respectively. The coloured lines change into the grey lines once the protoplanet mass exceeds a threshold value, beyond which the accretion bands disappear (see Fig. 3).
Current usage metrics show cumulative count of Article Views (full-text article views including HTML views, PDF and ePub downloads, according to the available data) and Abstracts Views on Vision4Press platform.
Data correspond to usage on the plateform after 2015. The current usage metrics is available 48-96 hours after online publication and is updated daily on week days.
Initial download of the metrics may take a while.