Free Access
Fig. 6
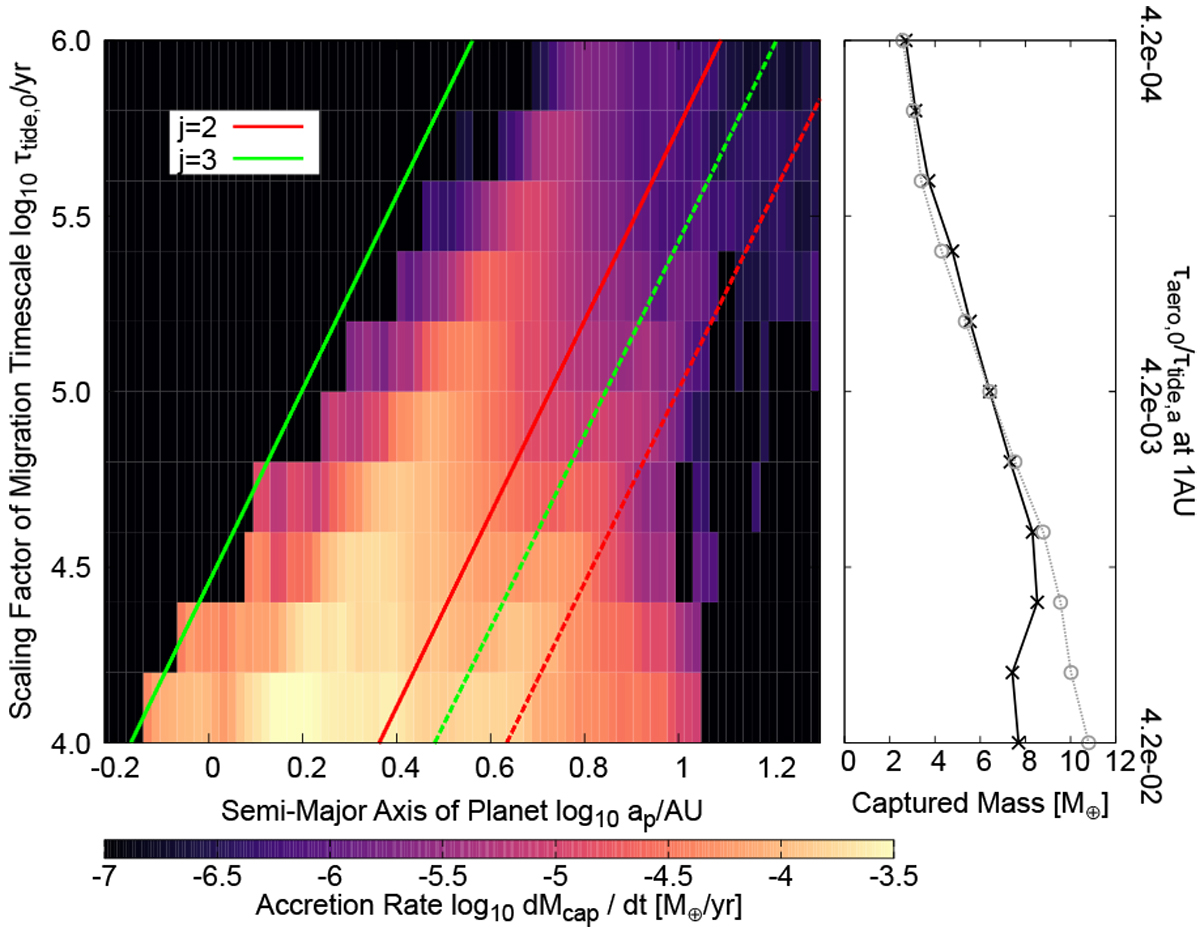
Download original image
Same as Fig. 5, but for the results of the parameter study regarding the migration timescale τtide,0. The grey circles in the right panel show the results of the parameter study regarding the size of planetesimals, Rpl, for comparison using the fraction of timescales τaero,0∕τtide,a on the vertical axis.
Current usage metrics show cumulative count of Article Views (full-text article views including HTML views, PDF and ePub downloads, according to the available data) and Abstracts Views on Vision4Press platform.
Data correspond to usage on the plateform after 2015. The current usage metrics is available 48-96 hours after online publication and is updated daily on week days.
Initial download of the metrics may take a while.