Free Access
Fig. 4
Download original image
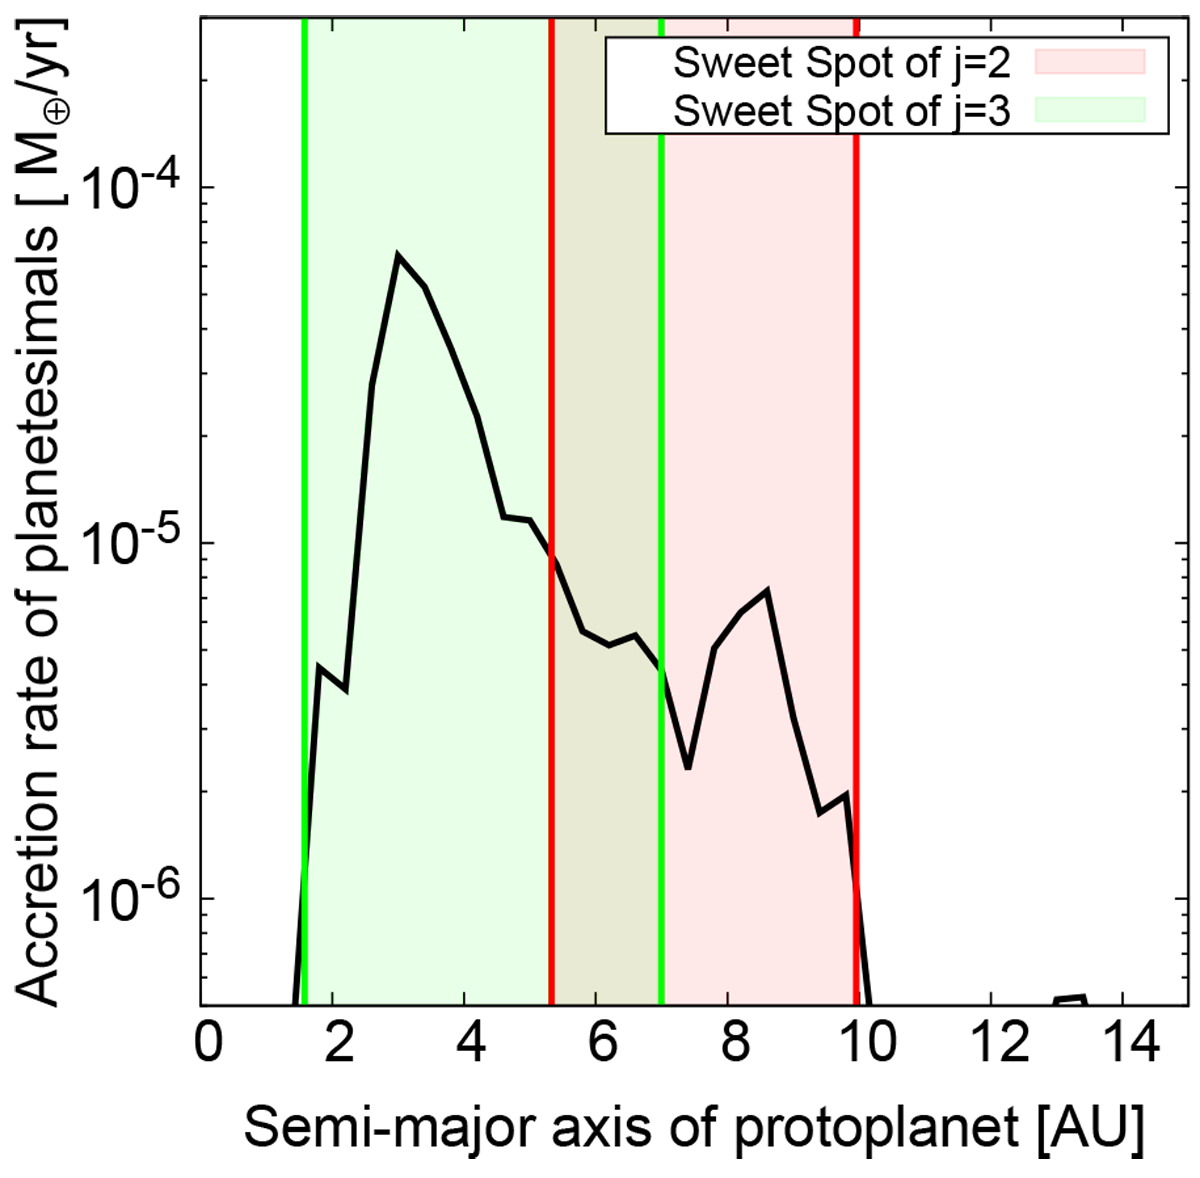
Planetesimal accretion rate vs. the semi-major axis of the migrating planet. The vertical solid lines showthe boundaries of the SSP given by Eq. (32). The red lines are for the case of j = 2 and the green lines are for j = 3. The filled areas show the SSP.
Current usage metrics show cumulative count of Article Views (full-text article views including HTML views, PDF and ePub downloads, according to the available data) and Abstracts Views on Vision4Press platform.
Data correspond to usage on the plateform after 2015. The current usage metrics is available 48-96 hours after online publication and is updated daily on week days.
Initial download of the metrics may take a while.