Fig. 12
Download original image
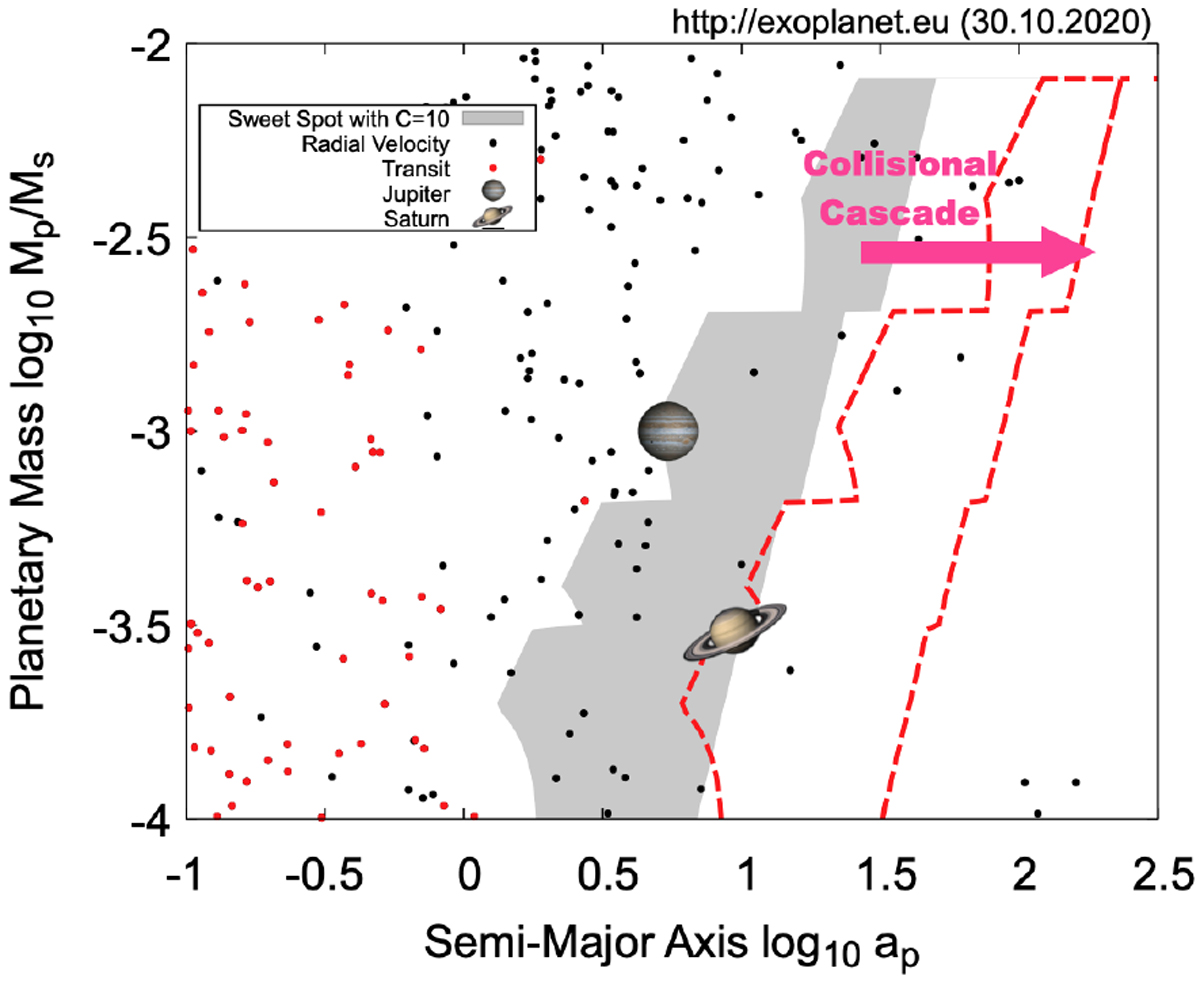
Distribution of confirmed exoplanets in the semi-major axis vs. planetary mass plane (http://exoplanet.eu). The black points are exoplanets observed by the radial-velocity method. The red points are exoplanets observed by the radial-velocity + transit methods. As for masses of exoplanets indicated with the black points, the observed values of Mp sin i are used. The grey area shows the theoretical sweet spot for planetesimal capture given by Eqs. (61) and (62) with C = 10. The red dashed line shows the theoretical sweet spot for planetesimal capture with C = 103, which corresponds to the case where collisional cascade have broken planetesimals down to Rpl ≲ 105 cm.
Current usage metrics show cumulative count of Article Views (full-text article views including HTML views, PDF and ePub downloads, according to the available data) and Abstracts Views on Vision4Press platform.
Data correspond to usage on the plateform after 2015. The current usage metrics is available 48-96 hours after online publication and is updated daily on week days.
Initial download of the metrics may take a while.