Fig. A.1.
Download original image
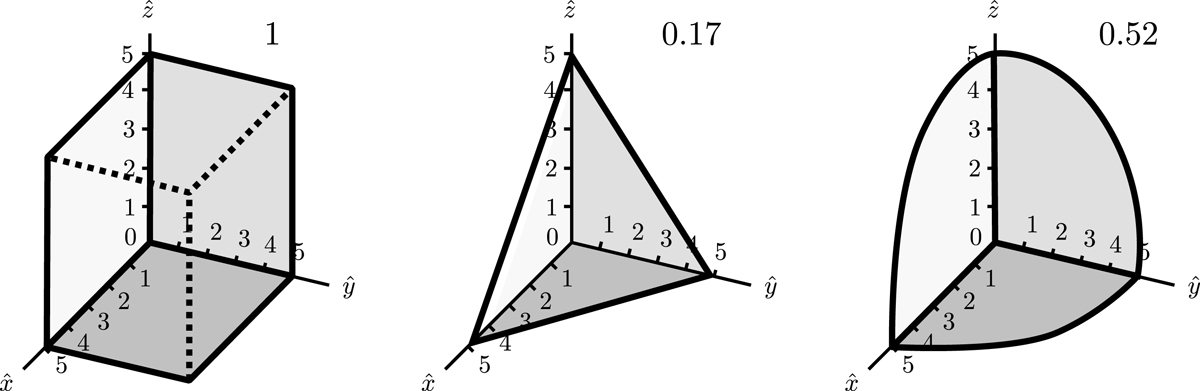
Schematic representation of three bases of the same order p = 5 for approximating the spatial variation of the problem variables in the computational domain. The numbers in the top right part of each diagram indicate the fraction of the number of the considered basis functions with respect to the full basis in the left diagram.
Current usage metrics show cumulative count of Article Views (full-text article views including HTML views, PDF and ePub downloads, according to the available data) and Abstracts Views on Vision4Press platform.
Data correspond to usage on the plateform after 2015. The current usage metrics is available 48-96 hours after online publication and is updated daily on week days.
Initial download of the metrics may take a while.