Fig. 6.
Download original image
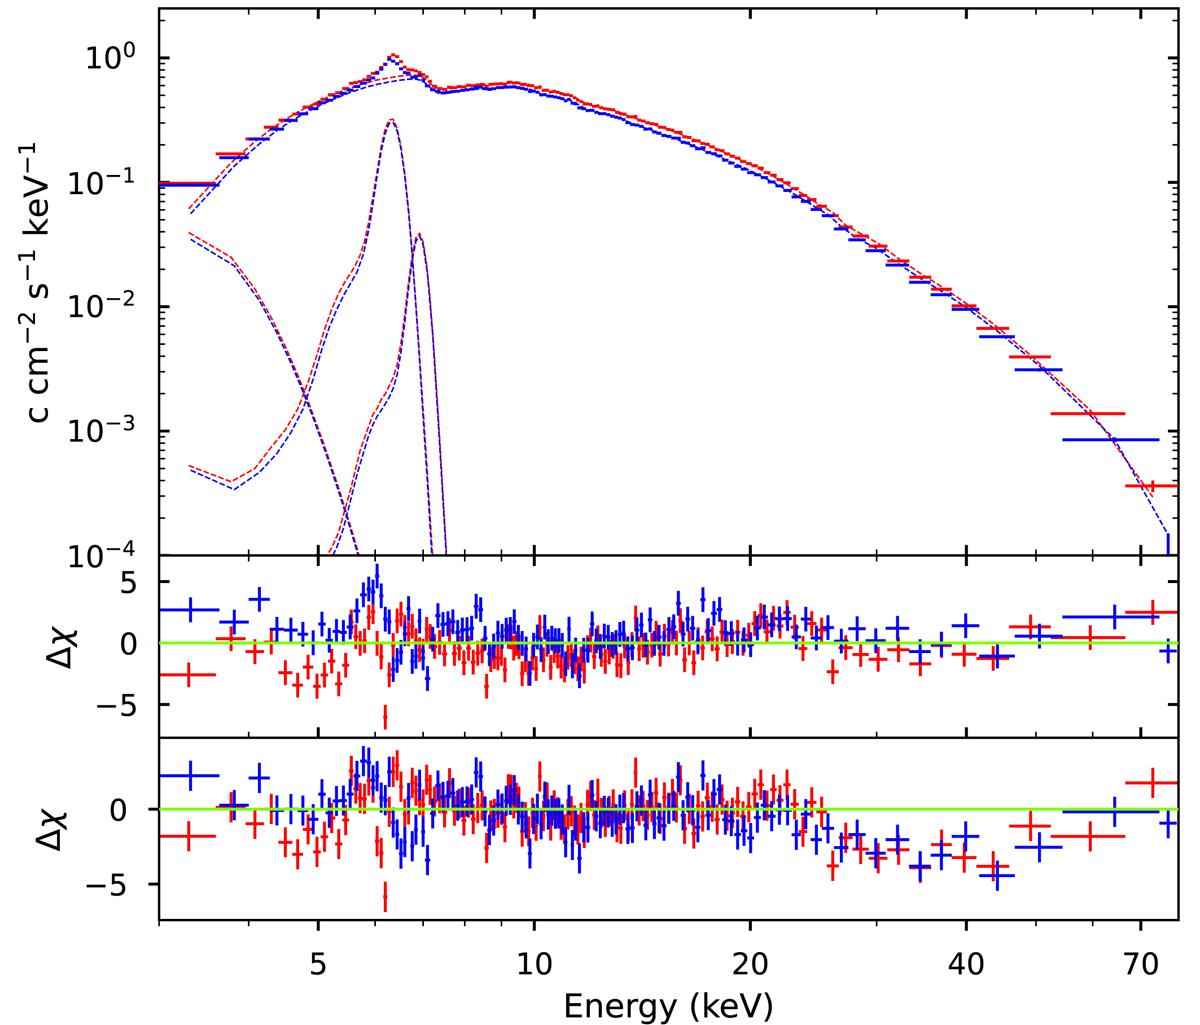
Top panel: NuSTAR’s FPMA and FPMB average energy spectrum for OAO 1657-415. The continuum can be described by contributions of an absorbed cut-off power law and a blackbody. Gaussian distributions were used to model emission lines seen at ∼6.4 keV and ∼7 keV. Middle panel: residuals associated with the continuum model. Bottom panel: residuals associated with the continuous model plus cyclabs with depth equal to zero. A clear count flux deficit can be seen at around ∼35 keV.
Current usage metrics show cumulative count of Article Views (full-text article views including HTML views, PDF and ePub downloads, according to the available data) and Abstracts Views on Vision4Press platform.
Data correspond to usage on the plateform after 2015. The current usage metrics is available 48-96 hours after online publication and is updated daily on week days.
Initial download of the metrics may take a while.