Fig. 5.
Download original image
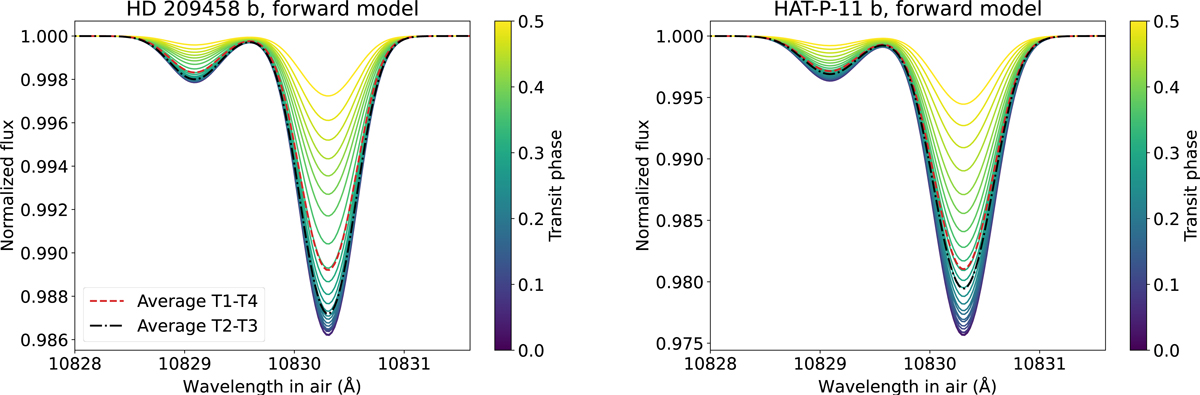
Metastable He transmission spectrum of HD 209458 b (left panel) and HAT-P-11 b (right panel) for uniformly sampled phases, transit impact parameter b = 0.499 and b = 0.132, respectively, and limb darkening based on the results of Knutson et al. (2007) and Sing (2010). The baseline (Rp/Rs)2 was removed, as in actual ground-based observations. Phase 0.0 and 0.5 represent, respectively, the times of mid-transit and of first (or fourth) contact. The dashed red spectrum is the average of all phases between the first and fourth contact. The dot-dashed black curve is the average between second and third contact. These are forward models, and we are not yet attempting to fit them to observed signatures.
Current usage metrics show cumulative count of Article Views (full-text article views including HTML views, PDF and ePub downloads, according to the available data) and Abstracts Views on Vision4Press platform.
Data correspond to usage on the plateform after 2015. The current usage metrics is available 48-96 hours after online publication and is updated daily on week days.
Initial download of the metrics may take a while.