Fig. 5.
Download original image
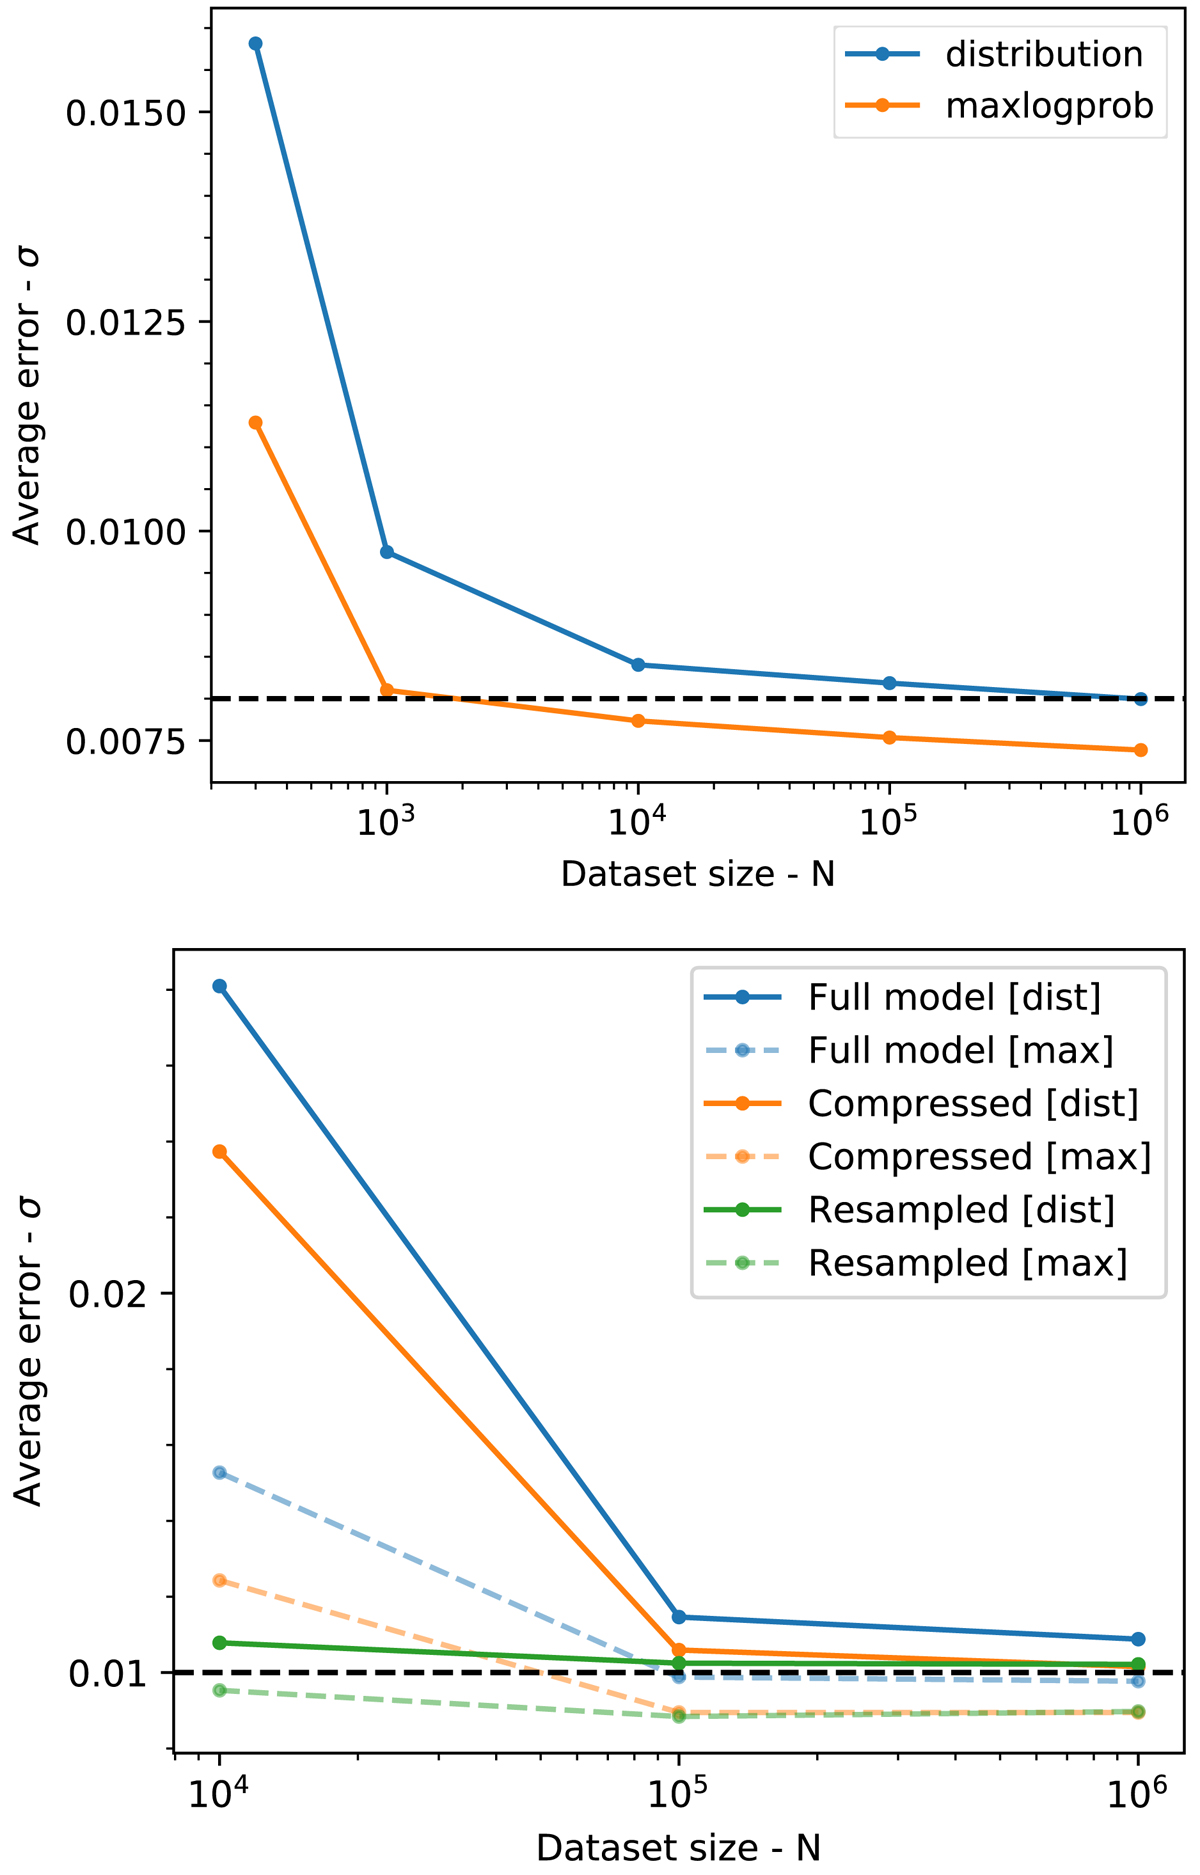
Statistical properties of the posterior predictive check. Upper panel: results for the ME case. The blue curve averages over the full posterior distribution and the orange curve shows the difference with respect to the mode of the posterior. Lower panel: same results but for the NLTE case. We also display the effect of compressing the model with an autoencoder and applying the resampling strategy.
Current usage metrics show cumulative count of Article Views (full-text article views including HTML views, PDF and ePub downloads, according to the available data) and Abstracts Views on Vision4Press platform.
Data correspond to usage on the plateform after 2015. The current usage metrics is available 48-96 hours after online publication and is updated daily on week days.
Initial download of the metrics may take a while.