Fig. 4.
Download original image
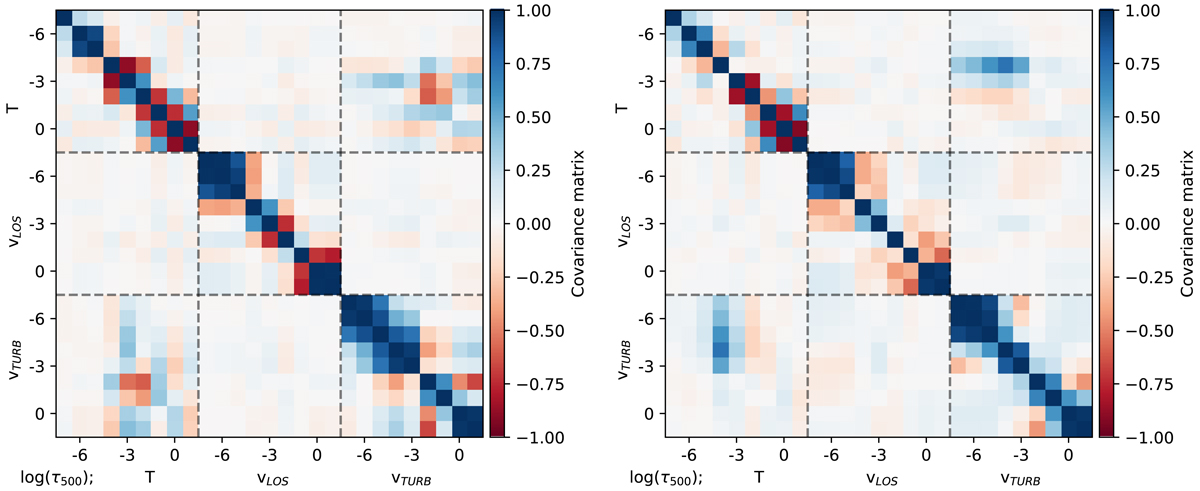
Correlation matrices calculated for the inferred atmospheric stratification for the emission (left) and absorption (right) profiles. Blue/red indicates positive/negative correlations, respectively. The optical depth increases towards the right and downwards so that each pair of physical quantities has the top of the atmosphere in the upper left corner and the bottom in the lower right corner.
Current usage metrics show cumulative count of Article Views (full-text article views including HTML views, PDF and ePub downloads, according to the available data) and Abstracts Views on Vision4Press platform.
Data correspond to usage on the plateform after 2015. The current usage metrics is available 48-96 hours after online publication and is updated daily on week days.
Initial download of the metrics may take a while.