Fig. 3.
Download original image
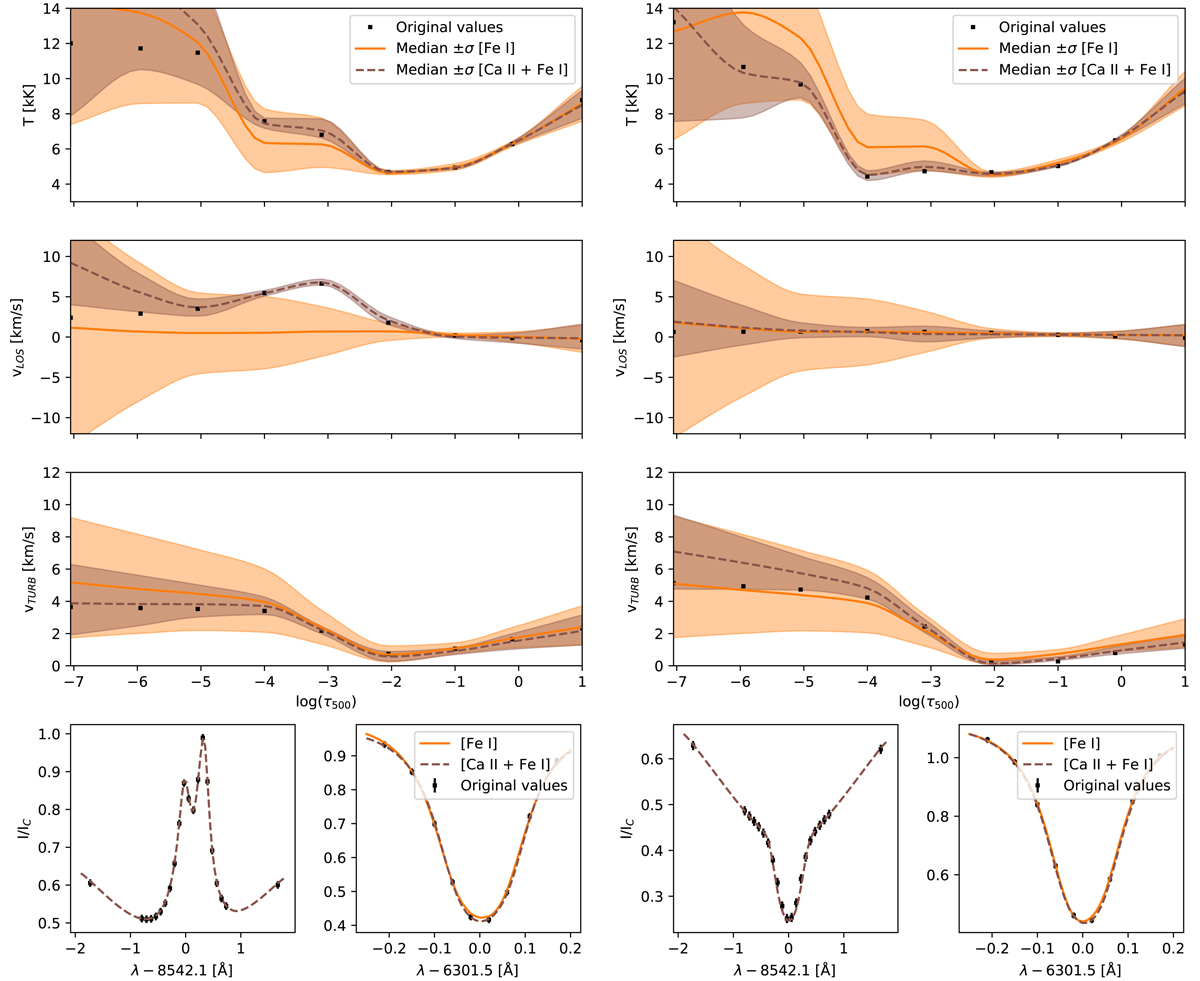
Atmospheric stratification inferred by the normalizing flow for two examples. In each column, the orange solution is inferred using only the Fe I line while the brown solution also uses the Ca II profile. The lowest row shows the original intensity values together with the synthetic calculation from the maximum a posteriori solution.
Current usage metrics show cumulative count of Article Views (full-text article views including HTML views, PDF and ePub downloads, according to the available data) and Abstracts Views on Vision4Press platform.
Data correspond to usage on the plateform after 2015. The current usage metrics is available 48-96 hours after online publication and is updated daily on week days.
Initial download of the metrics may take a while.