Free Access
Fig. A.2.
Download original image
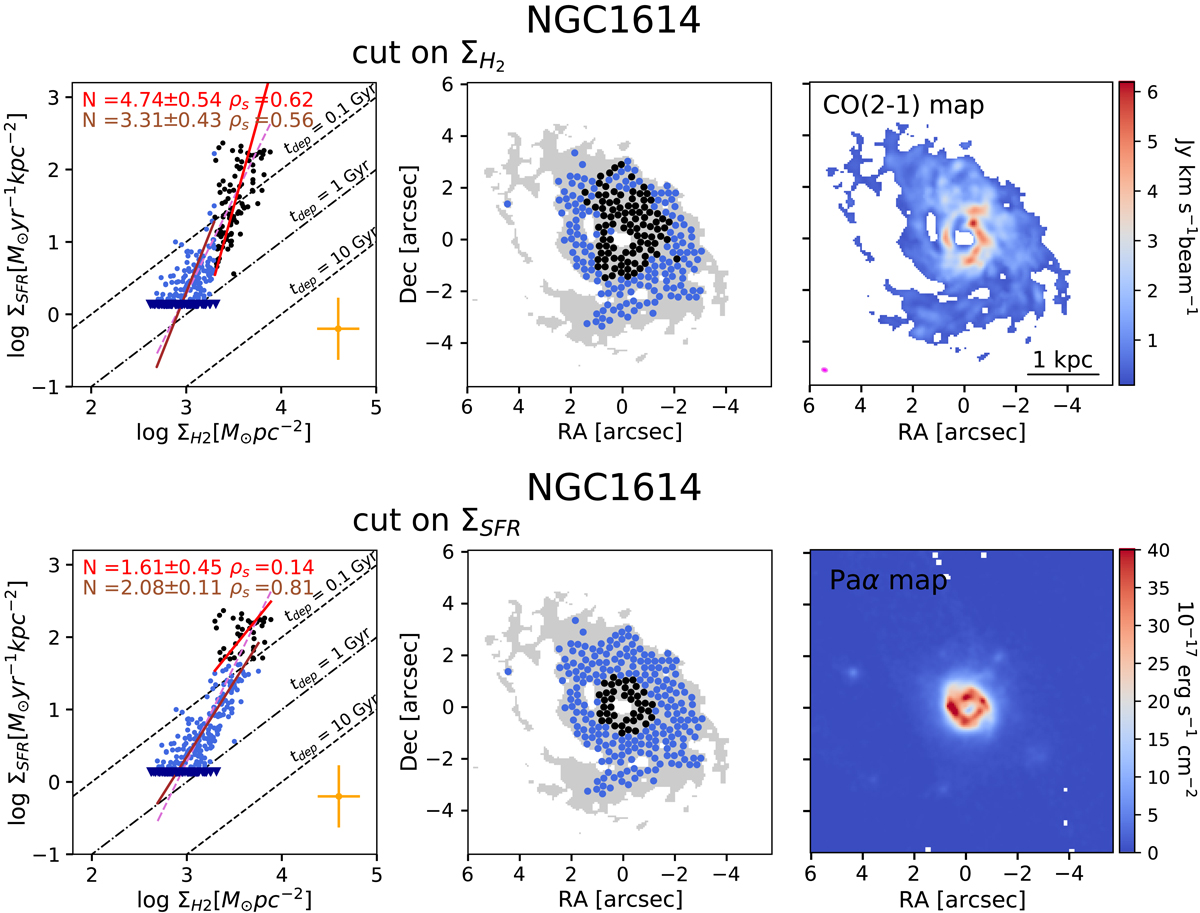
Same as Fig. 1, but applying the MARS method to the log10ΣH2 (top left and middle) and log10ΣSFR (bottom left and middle). Right panels: ALMA CO(2–1) (top) and HST/NICMOS Paα maps (bottom). This last map is smoothed to the ALMA resolution. The magenta filled ellipse represents the beam size.
Current usage metrics show cumulative count of Article Views (full-text article views including HTML views, PDF and ePub downloads, according to the available data) and Abstracts Views on Vision4Press platform.
Data correspond to usage on the plateform after 2015. The current usage metrics is available 48-96 hours after online publication and is updated daily on week days.
Initial download of the metrics may take a while.