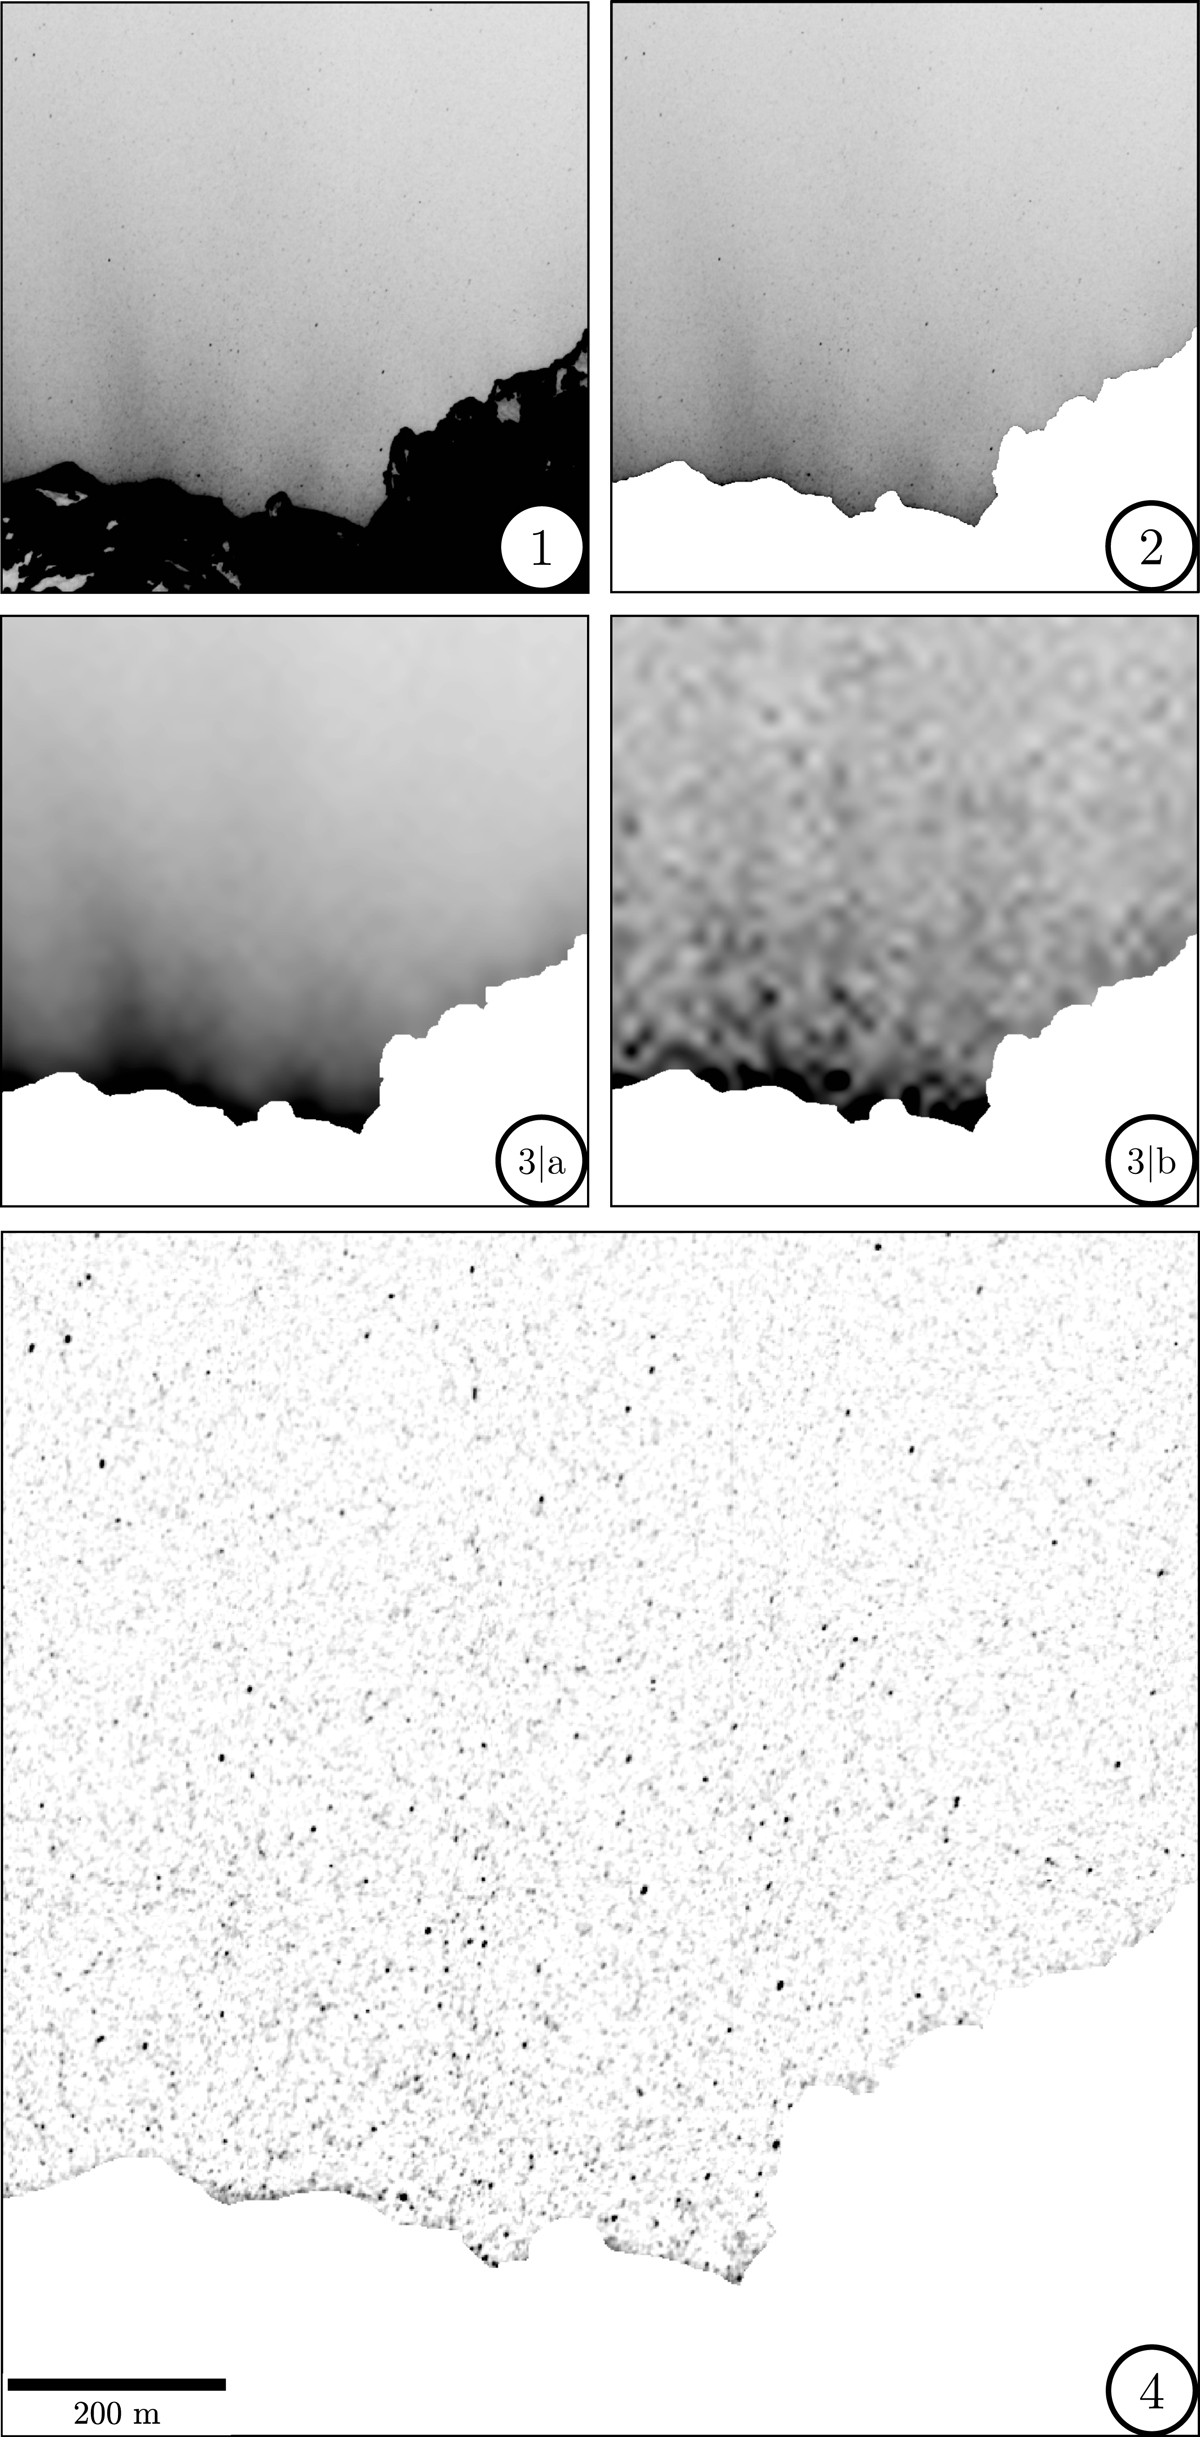
Fig. 3.
Download original image
Illustration of the cleaning pipeline: (1) the unaltered source image (OSIRIS level 3E); (2) the masked-out nucleus; (3) the estimated background level (a) and the corresponding RMS map of the background-subtracted image (b); (4) the background- and nucleus-subtracted image predominated by dust particles. All images show the same central region indicated in Fig. 2 and are brightness-inverted for better reading.
Current usage metrics show cumulative count of Article Views (full-text article views including HTML views, PDF and ePub downloads, according to the available data) and Abstracts Views on Vision4Press platform.
Data correspond to usage on the plateform after 2015. The current usage metrics is available 48-96 hours after online publication and is updated daily on week days.
Initial download of the metrics may take a while.