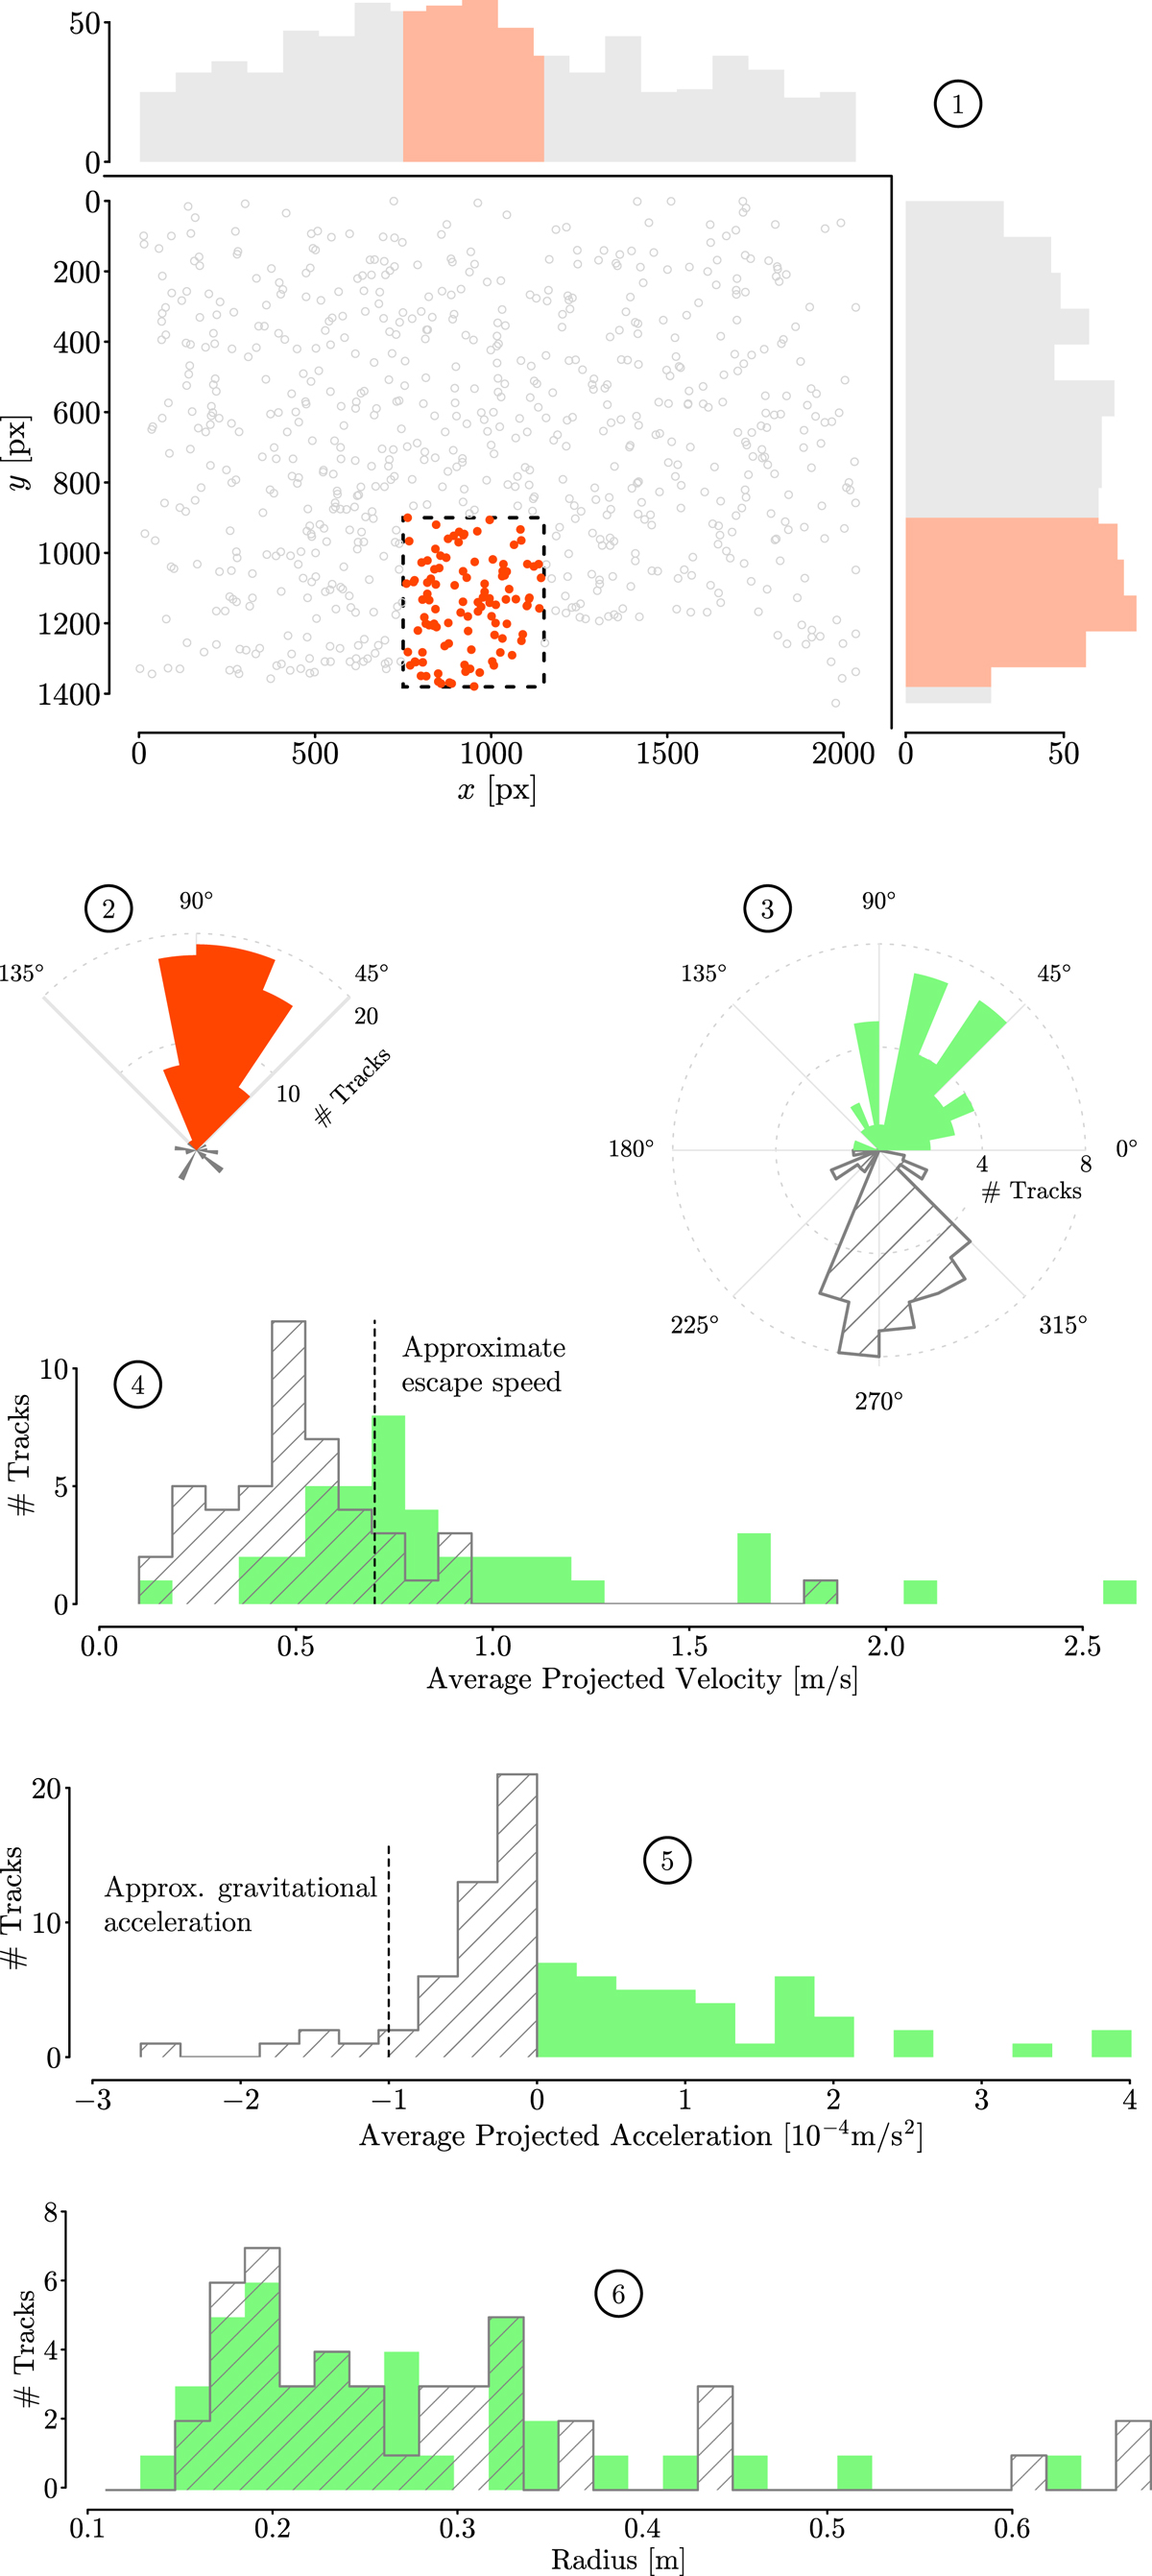
Fig. 19.
Download original image
Selection process and statistics of particles that likely originated from the central active area: (1) the starting points of all 775 tracks (i.e., their earliest confirmed locations) and the tracks we selected (orange circles) that start near the active area. (2) a further reduction of the tracks selected in (1) by choosing only the ones directed upward ±45° (orange). (3) the acceleration angle distribution of the tracks selected in (2), which is further divided into tracks that are accelerated upward (green) and downward (gray hashed). (4, 5, 6) the projected velocity, magnitude of acceleration and radius distributions for the two track populations defined in (3). Escape speed and gravitational acceleration based on Pätzold et al. (2016).
Current usage metrics show cumulative count of Article Views (full-text article views including HTML views, PDF and ePub downloads, according to the available data) and Abstracts Views on Vision4Press platform.
Data correspond to usage on the plateform after 2015. The current usage metrics is available 48-96 hours after online publication and is updated daily on week days.
Initial download of the metrics may take a while.