Fig. 16.

Download original image
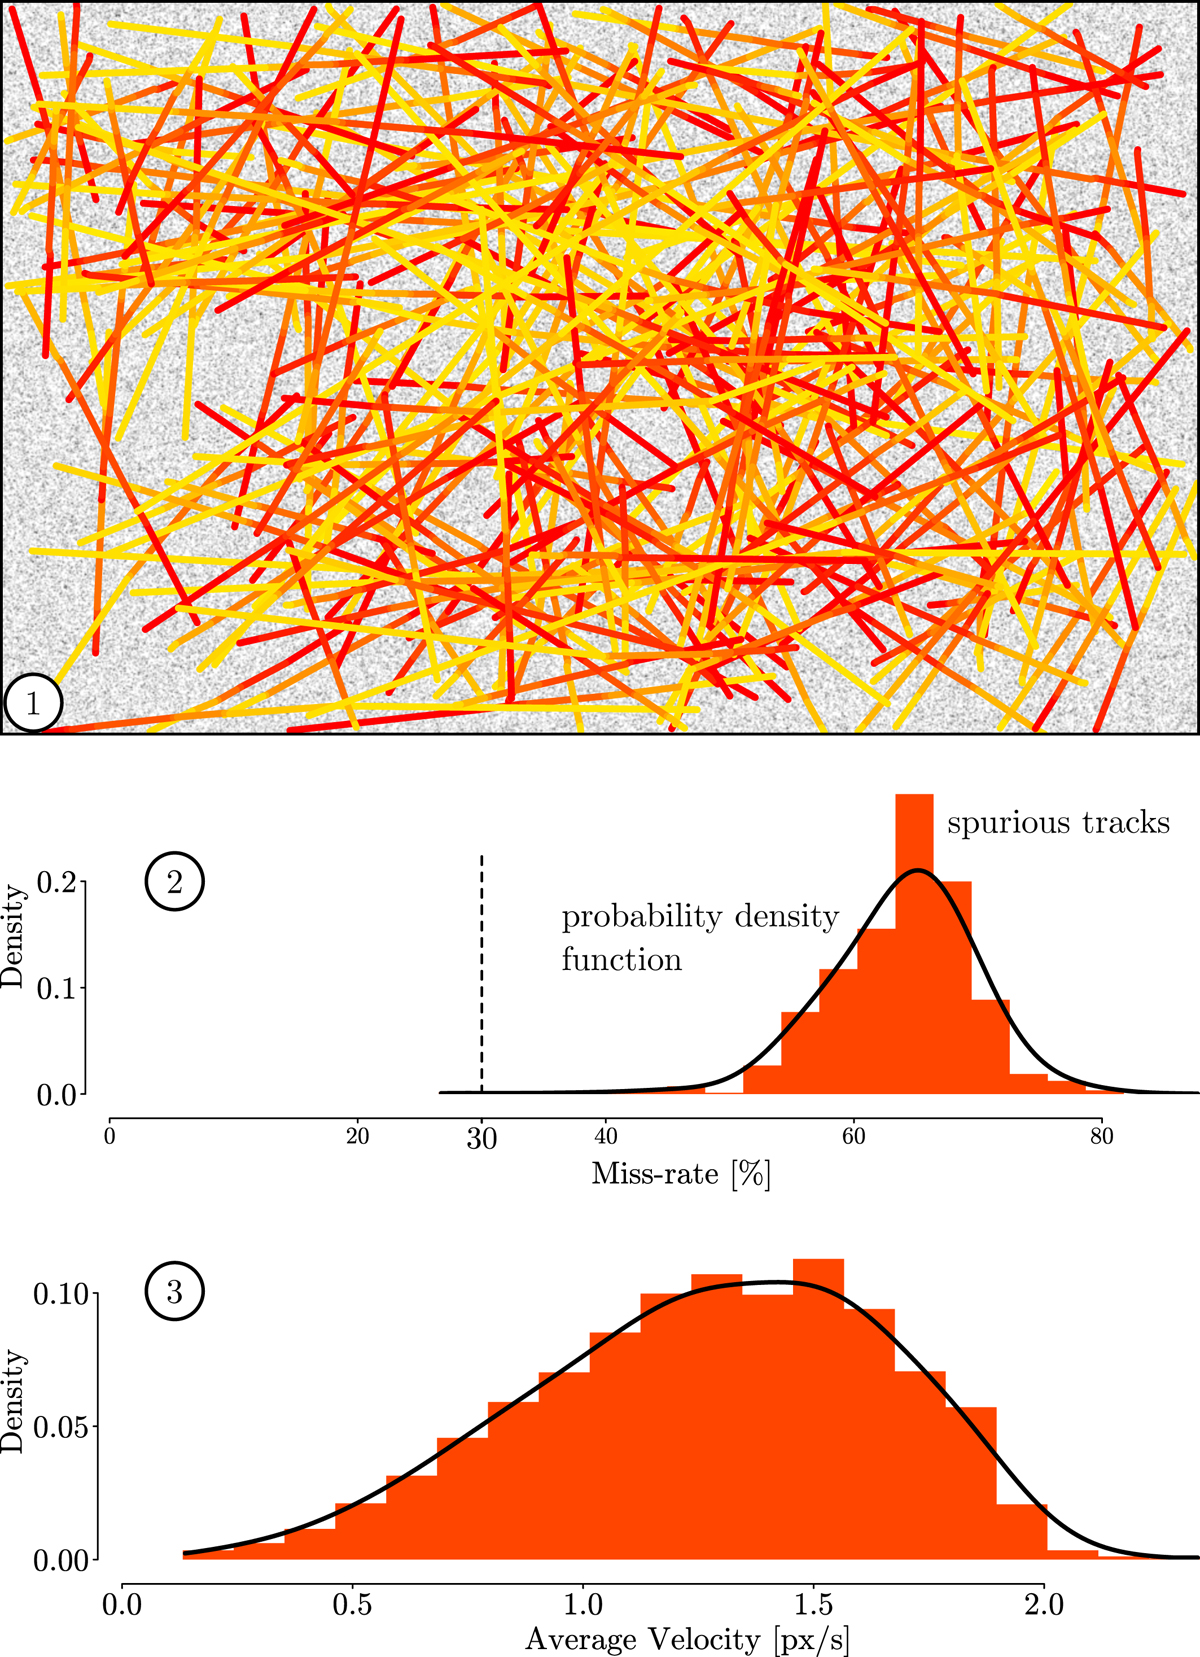
Results from simulated data: (1) one of the ten simulations with a detection density of 27.59 × 10⁻⁴ det. px−1. The identified tracks are shown as gradient lines from red to yellow. The background image serves merely as a visual aid, showing the rough locations of detections (it is not a stack of images created to run the detection algorithm on; instead the detections were simulated first and the background image was created retroactively). (2) the combined miss-rate distribution from the ten simulations with a detection density of 27.59 × 10⁻⁴ det. px−1. (3) the velocity distribution of the same track population, showing a clear tendency of the algorithm to create more fast spurious tracks, especially when compared to velocity distributions from real data (Fig. 17.2). The probability density functions were created with Gaussian kernel density estimation.
Current usage metrics show cumulative count of Article Views (full-text article views including HTML views, PDF and ePub downloads, according to the available data) and Abstracts Views on Vision4Press platform.
Data correspond to usage on the plateform after 2015. The current usage metrics is available 48-96 hours after online publication and is updated daily on week days.
Initial download of the metrics may take a while.


