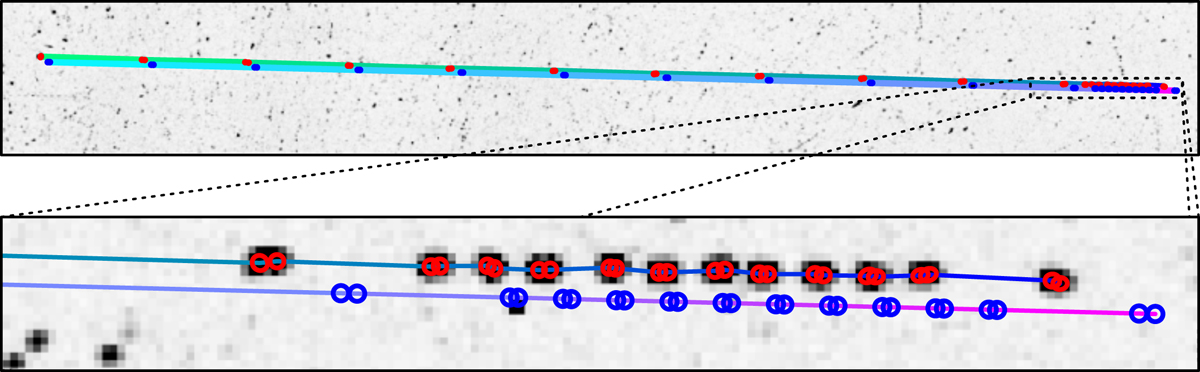
Fig. 13.
Download original image
Sample of a sidereal track (top line from dark blue to green, detections indicated by red ellipses) and the expected motion of a sidereal object it was matched with (bottom line from violet to aquamarine, expected positions indicated by blue circles). The top panel shows the whole track, the bottom one a close-up of the first 24 detections, including the entire principal sequence. The pointing fluctuation is mainly acting along the direction of motion from right to left.
Current usage metrics show cumulative count of Article Views (full-text article views including HTML views, PDF and ePub downloads, according to the available data) and Abstracts Views on Vision4Press platform.
Data correspond to usage on the plateform after 2015. The current usage metrics is available 48-96 hours after online publication and is updated daily on week days.
Initial download of the metrics may take a while.