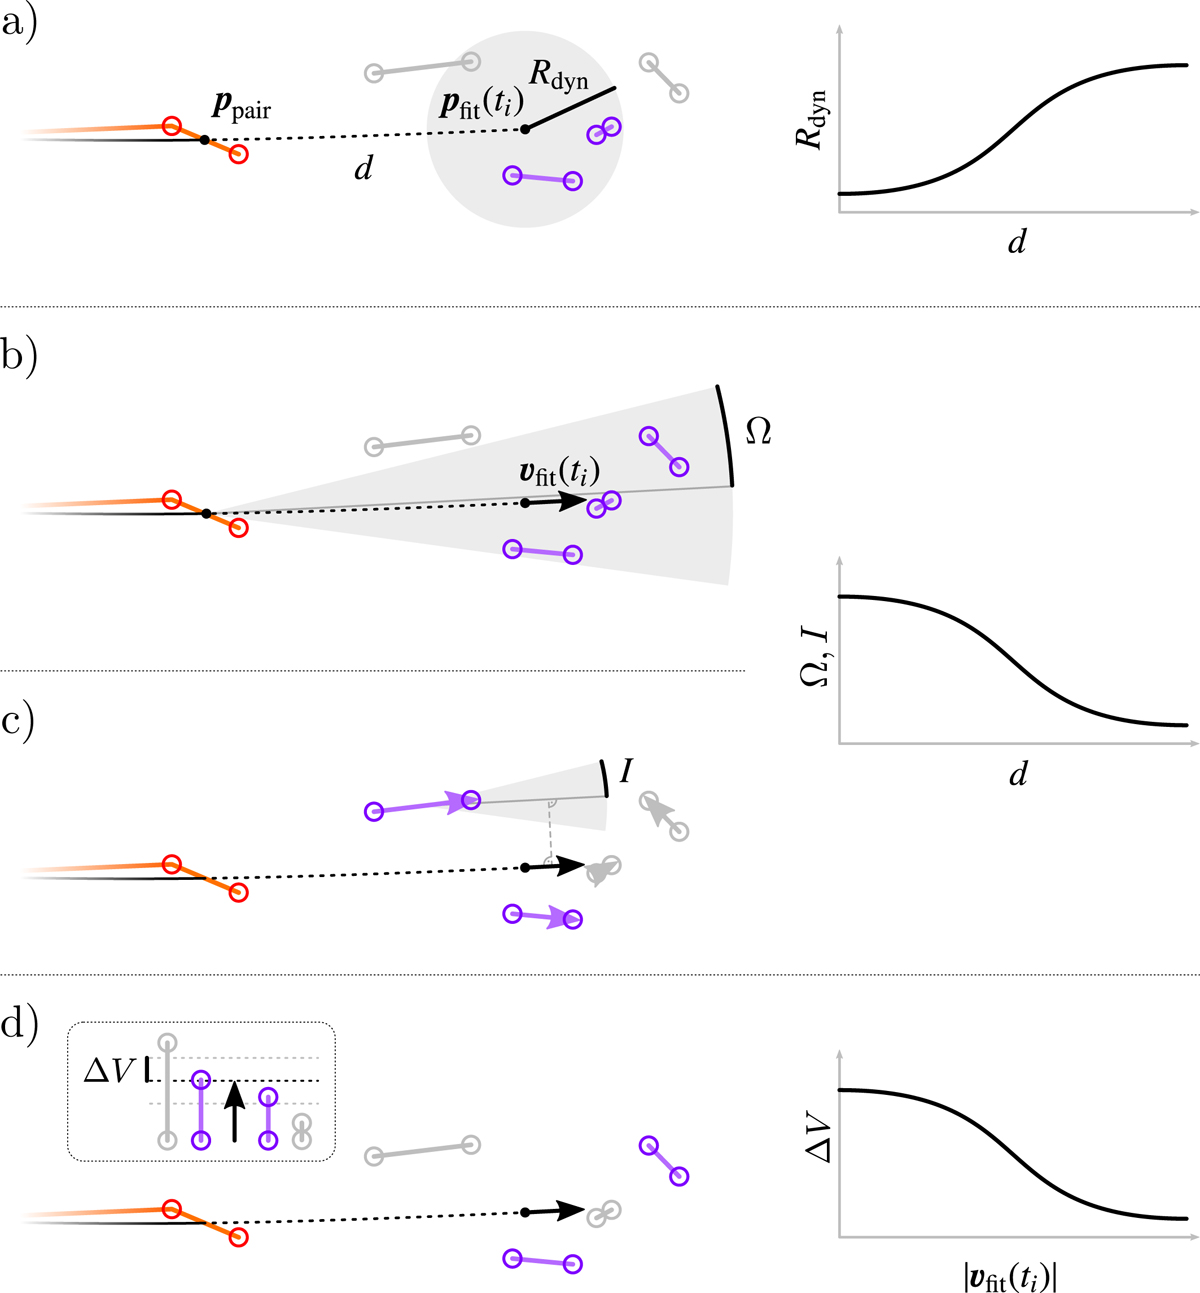
Fig. 10.
Download original image
Diagrams illustrating how the dynamic tracking parameters operate (pairs that satisfy the respective criteria are shown in violet, the ones that do not in gray): (a) the dynamic search radius Rdyn, which defines the area the algorithm searches for candidate pairs or detections. It depends on the distance d between the candidate track’s pair ppair closest in time to the investigated step, and the predicted position pfit(ti) where the next pair is expected to lie according the curve (black, partly dashed line) fitted to the track (orange path). The relation between Rdyn and d is that of an arctangent (see Eq. (2)) shown by the graph on the right. (b) the (maximum) offset angle Ω, which defines a circular sector within which candidate pairs or detections must lie. The sector originates from the candidate track’s closest pair and opens up in the same direction as the fitted curve at the investigated time-step (vfit(ti), black arrow). The offset angle also depends on d in the form of an arctangent, although reversed, as shown by the graph on the right (see Eq. (3)). (c) the (maximum) inclination angle I, whose value is equal to that of Ω. It defines the maximum inclination candidate pairs can have with respect to vfit(ti). (d) the relative difference in speed ΔV, which determines how much the speed of a candidate pair can relatively deviate from |vfit(ti)|. The relation between ΔV and |vfit(ti)| is also that of a reversed arctangent as shown by the graph on the right (see Eq. (4)).
Current usage metrics show cumulative count of Article Views (full-text article views including HTML views, PDF and ePub downloads, according to the available data) and Abstracts Views on Vision4Press platform.
Data correspond to usage on the plateform after 2015. The current usage metrics is available 48-96 hours after online publication and is updated daily on week days.
Initial download of the metrics may take a while.