Fig. 9.
Download original image
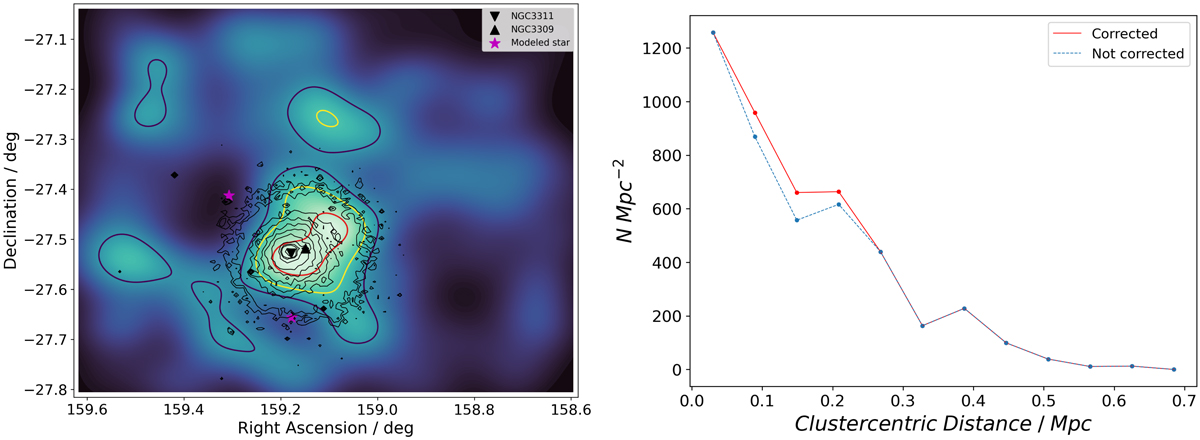
Projected galaxy density distribution inside the Hydra I cluster. Left panel: smoothed number density distribution of the galaxies in the Hydra I galaxy cluster. The observed galaxy distribution is convolved with a Gaussian kernel with σ = 10′. The colored contours highlight the iso-density curves (red, yellow and purple). X-ray contours (thin black lines) are also overlaid to the map. The two giant galaxies at the center of the cluster are represented by the two black triangles, while the magenta stars are the two modeled stars in the field. North is up, east is left. Right panel: projected galaxy surface density, as number of galaxies per square Mpc, plotted against the projected clustercentric distance. Red solid line is the density profile accounting for the area of the two saturated stars, while blue dashed line is the profile without correcting for that area.
Current usage metrics show cumulative count of Article Views (full-text article views including HTML views, PDF and ePub downloads, according to the available data) and Abstracts Views on Vision4Press platform.
Data correspond to usage on the plateform after 2015. The current usage metrics is available 48-96 hours after online publication and is updated daily on week days.
Initial download of the metrics may take a while.