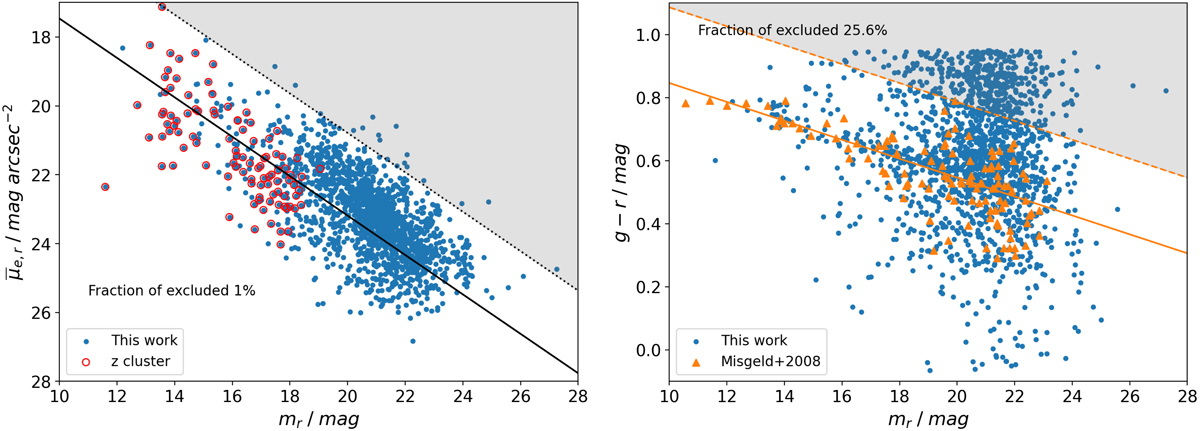
Fig. 6.
Download original image
Scaling relations used for the galaxy selection. Left panel: mean effective surface brightness vs total magnitude (r-band) plane for catalog objects that passed the first selection cut. The black solid line is the linear fit of the redshift confirmed cluster members. The data of Christlein & Zabludoff (2003) are represented by red open circles. The dotted line indicates 2 standard deviations from the cluster sequence: the objects in the shaded gray area are removed from the sample. Right panel: color-magnitude diagram for galaxies that passed the first two cuts. Orange triangles are early-type galaxies found by Misgeld et al. (2008), and the orange solid line is their CMR. The dashed line is the 2 rms level we use to define galaxies as members of the Hydra I cluster.
Current usage metrics show cumulative count of Article Views (full-text article views including HTML views, PDF and ePub downloads, according to the available data) and Abstracts Views on Vision4Press platform.
Data correspond to usage on the plateform after 2015. The current usage metrics is available 48-96 hours after online publication and is updated daily on week days.
Initial download of the metrics may take a while.