Free Access
Fig. 3.
Download original image
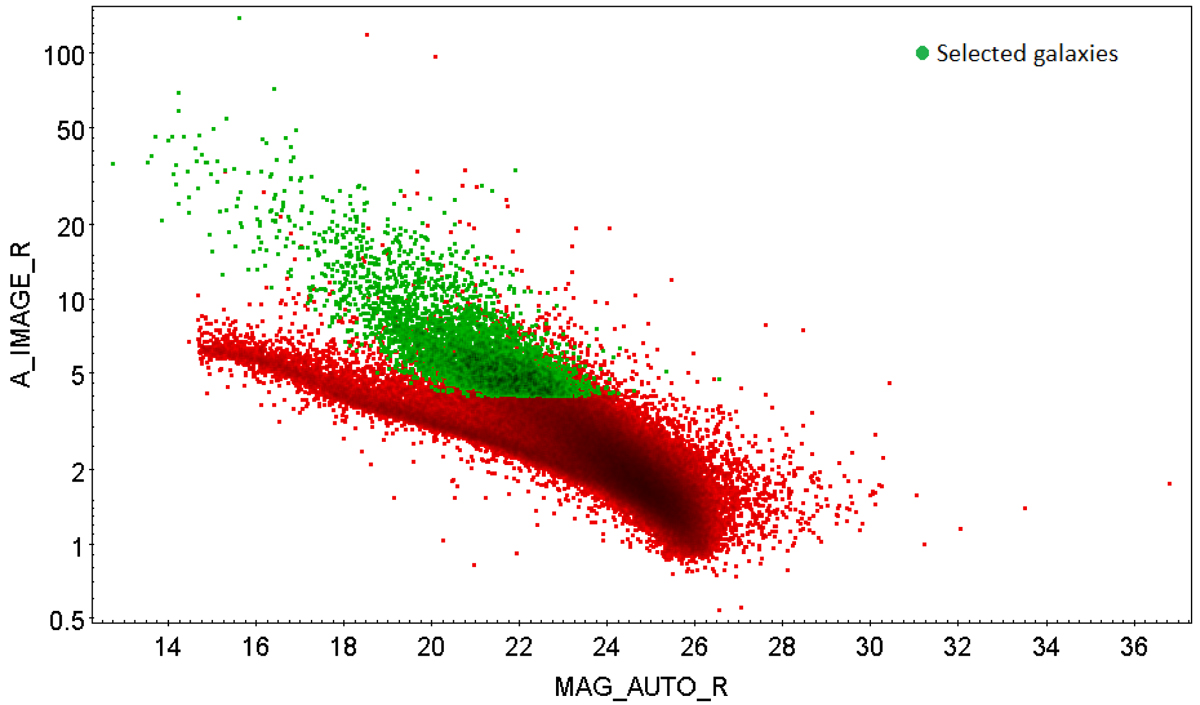
Size-magnitude diagram for detected sources, with size in pixels. Green dots represents the galaxies selected for the final clean catalog, i.e. have semi-major axis larger than 4 pixels, and have passed all the previous steps.
Current usage metrics show cumulative count of Article Views (full-text article views including HTML views, PDF and ePub downloads, according to the available data) and Abstracts Views on Vision4Press platform.
Data correspond to usage on the plateform after 2015. The current usage metrics is available 48-96 hours after online publication and is updated daily on week days.
Initial download of the metrics may take a while.