Fig. 20.
Download original image
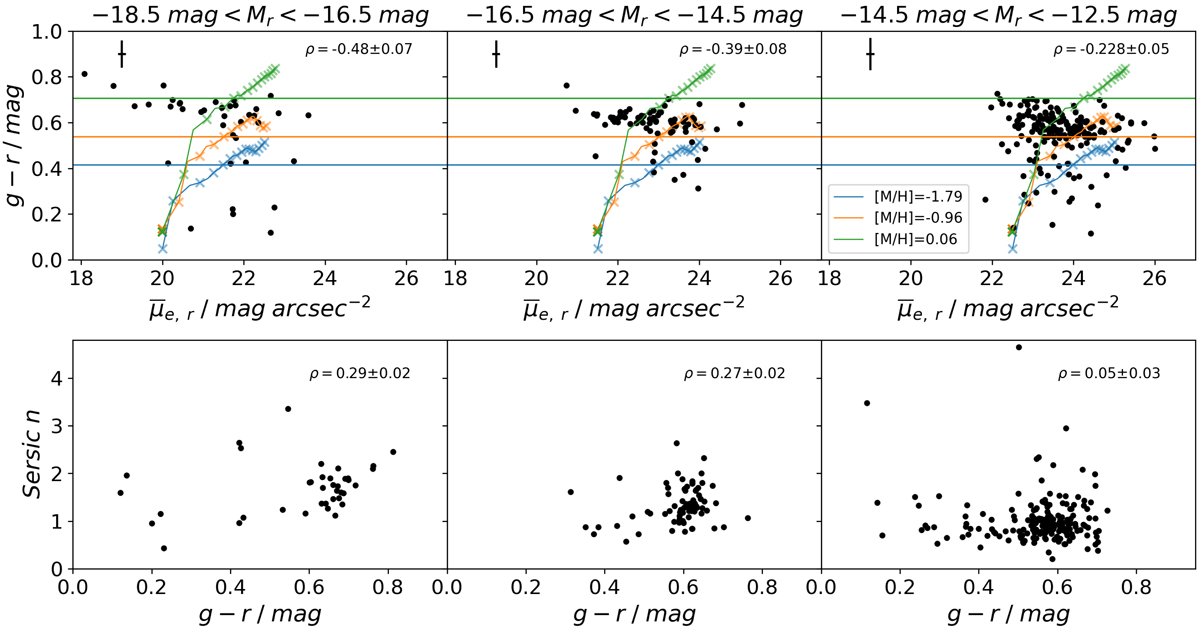
Top panels: dwarf galaxies g − r colors as a function of the r-band mean effective surface brightness. Evolutionary tracks of single stellar population for a Kroupa-like IMF for different metallicities are shown. The crosses on each track correspond to 0.5, 1, 2, 3, …, 13, 14 Gyr. Horizontal lines show the 4 Gyr age level of each track. Lower panels: galaxies Sérsic indices n as a function of their colors. Galaxies are split in three luminosity bins, represented by the different columns. In each panel is reported the ρ value of the corresponding Spearman’s correlation test, and its error.
Current usage metrics show cumulative count of Article Views (full-text article views including HTML views, PDF and ePub downloads, according to the available data) and Abstracts Views on Vision4Press platform.
Data correspond to usage on the plateform after 2015. The current usage metrics is available 48-96 hours after online publication and is updated daily on week days.
Initial download of the metrics may take a while.