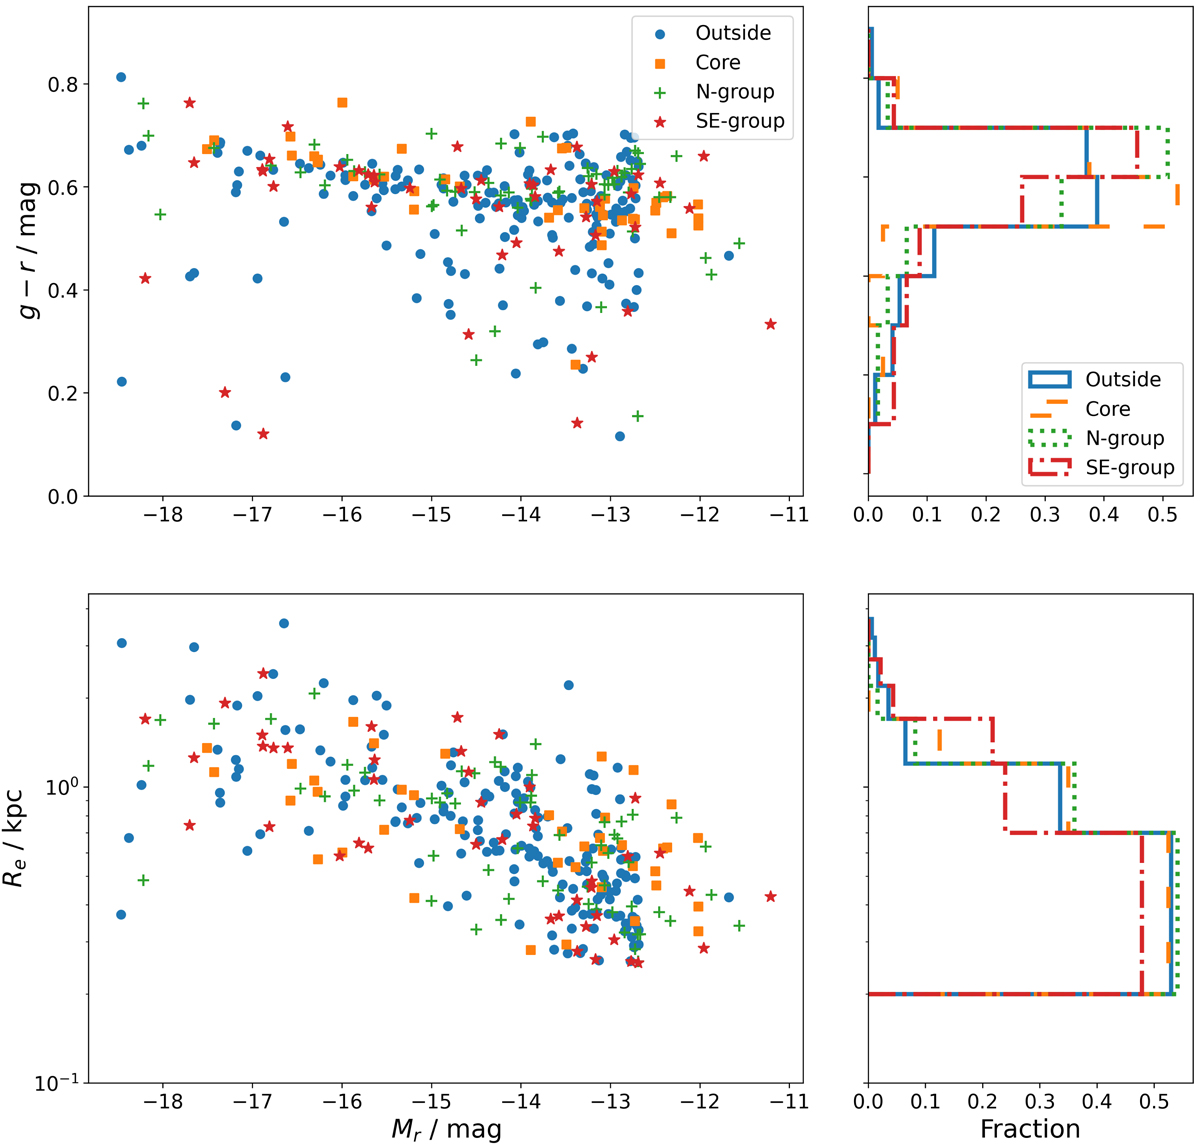
Fig. 19.
Download original image
Comparison between dwarf galaxies in different cluster substructures. Dwarfs not included in the three main subgroups are labeled as “Outside”. Top panels: the color-magnitude diagram is shown on the left, while the g − r color distributions are shown as histograms on the right panel. Symbol definitions are given in the legends. Bottom panels: on the left is reported the Re vs. Mr plane, while on the right are the Re distributions for dwarfs in the four substructures.
Current usage metrics show cumulative count of Article Views (full-text article views including HTML views, PDF and ePub downloads, according to the available data) and Abstracts Views on Vision4Press platform.
Data correspond to usage on the plateform after 2015. The current usage metrics is available 48-96 hours after online publication and is updated daily on week days.
Initial download of the metrics may take a while.