Fig. 18.
Download original image
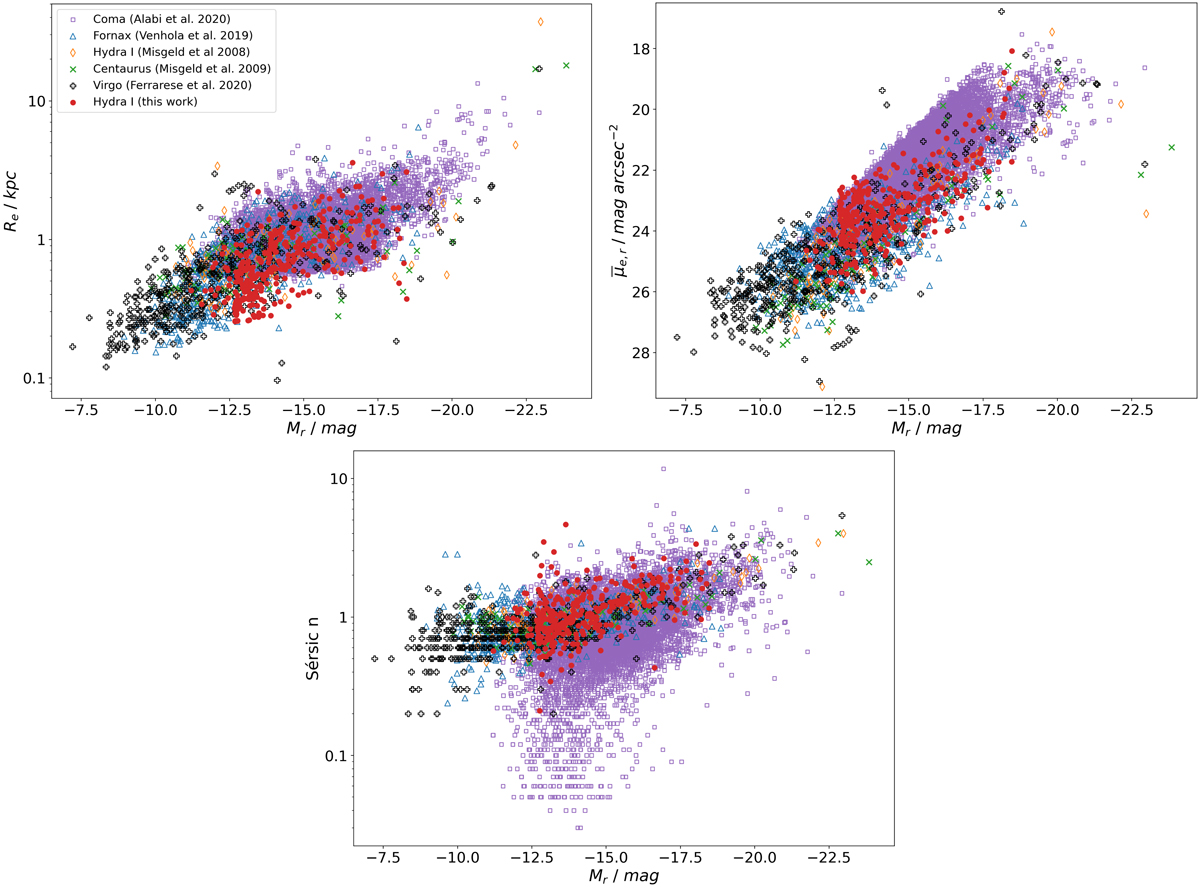
Comparison of galaxies scaling relations among different Local Universe clusters. Top-left panel: effective radius vs. r-band magnitude (Mr). Top-right panel: mean effective surface brightness (r-band) as a function of the absolute r-band magnitude. Bottom panel: Sérsic index n as a function of Mr. The red circles represents Hydra I dwarf galaxies from our sample. The open blue triangles are the Fornax dwarfs (Venhola et al. 2019). The open orange diamonds indicate Hydra I early-types galaxies by Misgeld et al. (2008), while the green crosses represents Centaurus cluster galaxies (Misgeld et al. 2009). Empty black plus are Virgo galaxies (NGVS sample Ferrarese et al. 2020); open purple squares are Coma galaxies (Alabi et al. 2020).
Current usage metrics show cumulative count of Article Views (full-text article views including HTML views, PDF and ePub downloads, according to the available data) and Abstracts Views on Vision4Press platform.
Data correspond to usage on the plateform after 2015. The current usage metrics is available 48-96 hours after online publication and is updated daily on week days.
Initial download of the metrics may take a while.