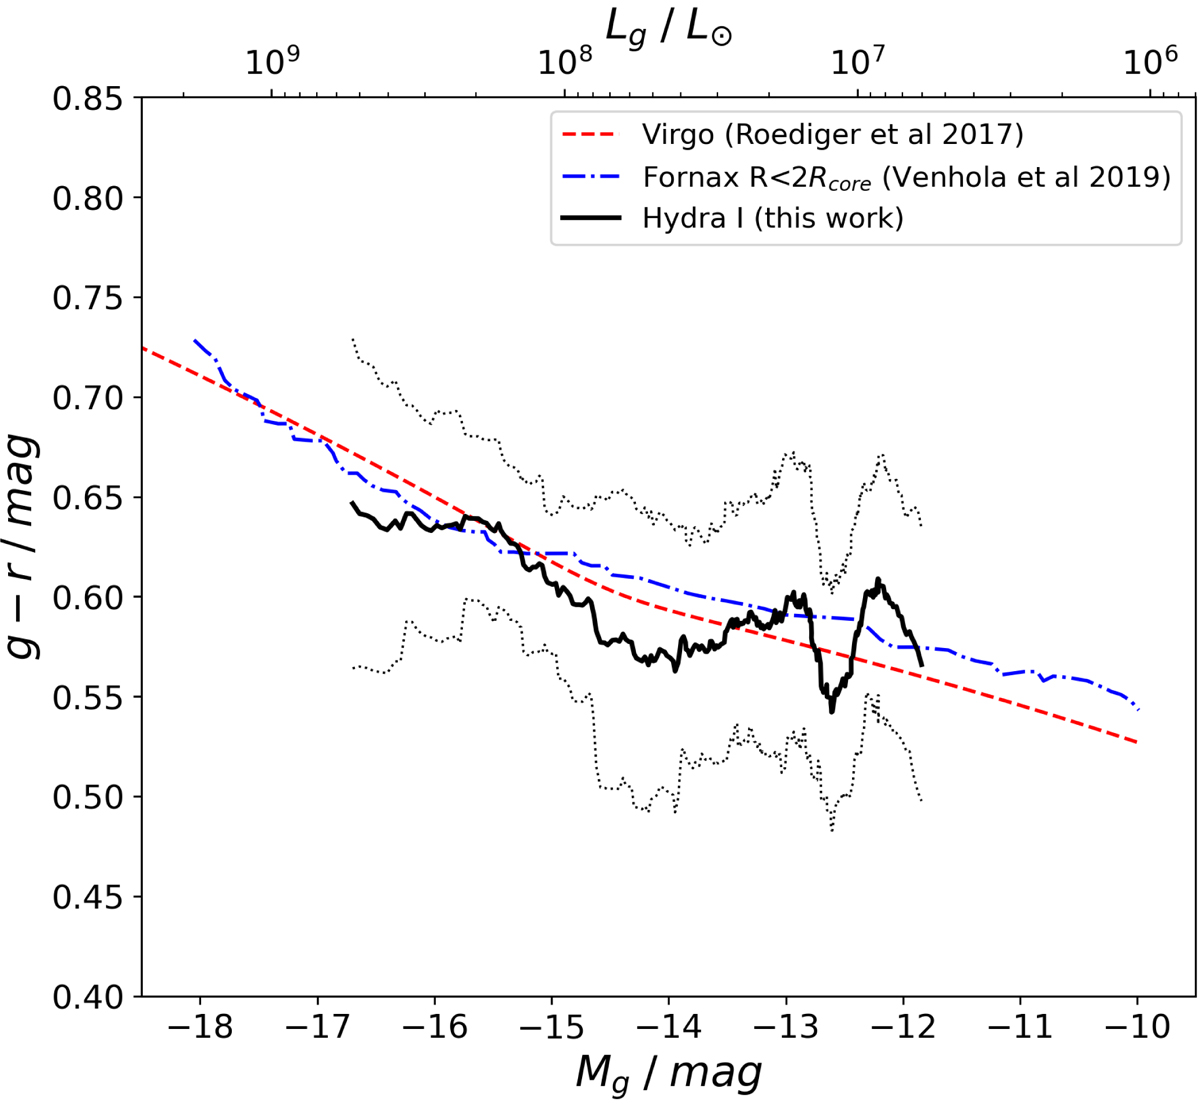
Fig. 17.
Download original image
Comparison between Hydra I color-magnitude relation in this work and the red sequence for the Virgo and Fornax clusters. The black line represents the running mean of the CMR for the Hydra I’s dwarfs in our sample, and the dotted lines show 1σ deviation (we use a fixed bin wide N = 30 individuals). The red dashed line is the CMR in the core of the Virgo cluster (Roediger et al. 2017). The blue dash-dotted line shows the Fornax CMR within 2Rcore (Venhola et al. 2019).
Current usage metrics show cumulative count of Article Views (full-text article views including HTML views, PDF and ePub downloads, according to the available data) and Abstracts Views on Vision4Press platform.
Data correspond to usage on the plateform after 2015. The current usage metrics is available 48-96 hours after online publication and is updated daily on week days.
Initial download of the metrics may take a while.