Fig. 14.
Download original image
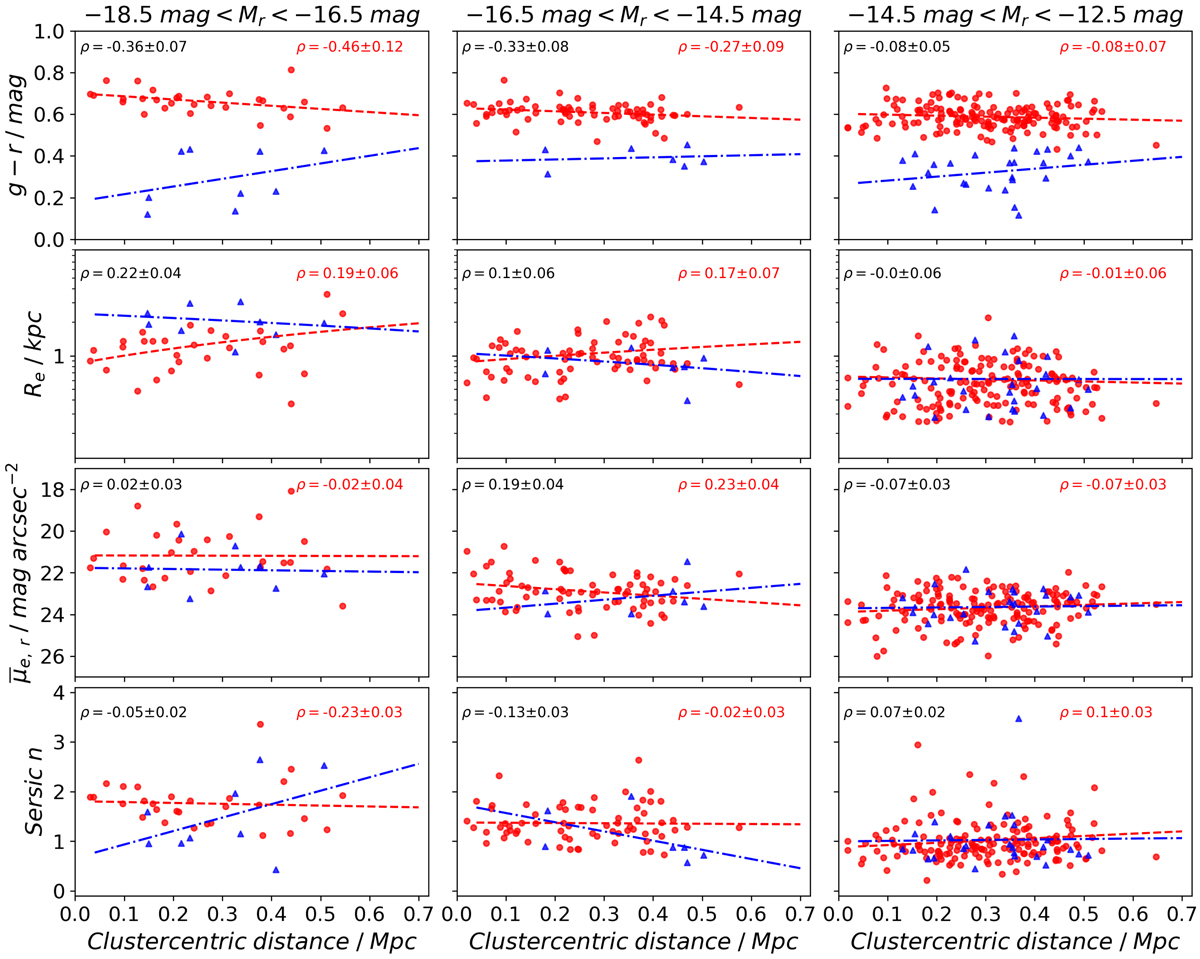
Structural parameters of Hydra’s dwarf galaxies as a function of their projected clustercentric distance. Panel rows from top to bottom show: g − r color, effective radius Re, mean effective surface brightness ![]() , and the Sérsic index n. Each column corresponds to a different luminosity bin. Linear trend lines are shown in each panel, for both dwarf populations. Red dots and dashed lines are used for red dwarfs, while blue triangles and dash-dotted lines represent the blue dwarf population. The ρ parameter in each panel expresses Spearman’s rank correlation coefficient for the correlation between the parameter and the distance from the cluster center (black indicates the whole dwarf sample, red only the red dwarfs).
, and the Sérsic index n. Each column corresponds to a different luminosity bin. Linear trend lines are shown in each panel, for both dwarf populations. Red dots and dashed lines are used for red dwarfs, while blue triangles and dash-dotted lines represent the blue dwarf population. The ρ parameter in each panel expresses Spearman’s rank correlation coefficient for the correlation between the parameter and the distance from the cluster center (black indicates the whole dwarf sample, red only the red dwarfs).
Current usage metrics show cumulative count of Article Views (full-text article views including HTML views, PDF and ePub downloads, according to the available data) and Abstracts Views on Vision4Press platform.
Data correspond to usage on the plateform after 2015. The current usage metrics is available 48-96 hours after online publication and is updated daily on week days.
Initial download of the metrics may take a while.