Fig. 12.
Download original image
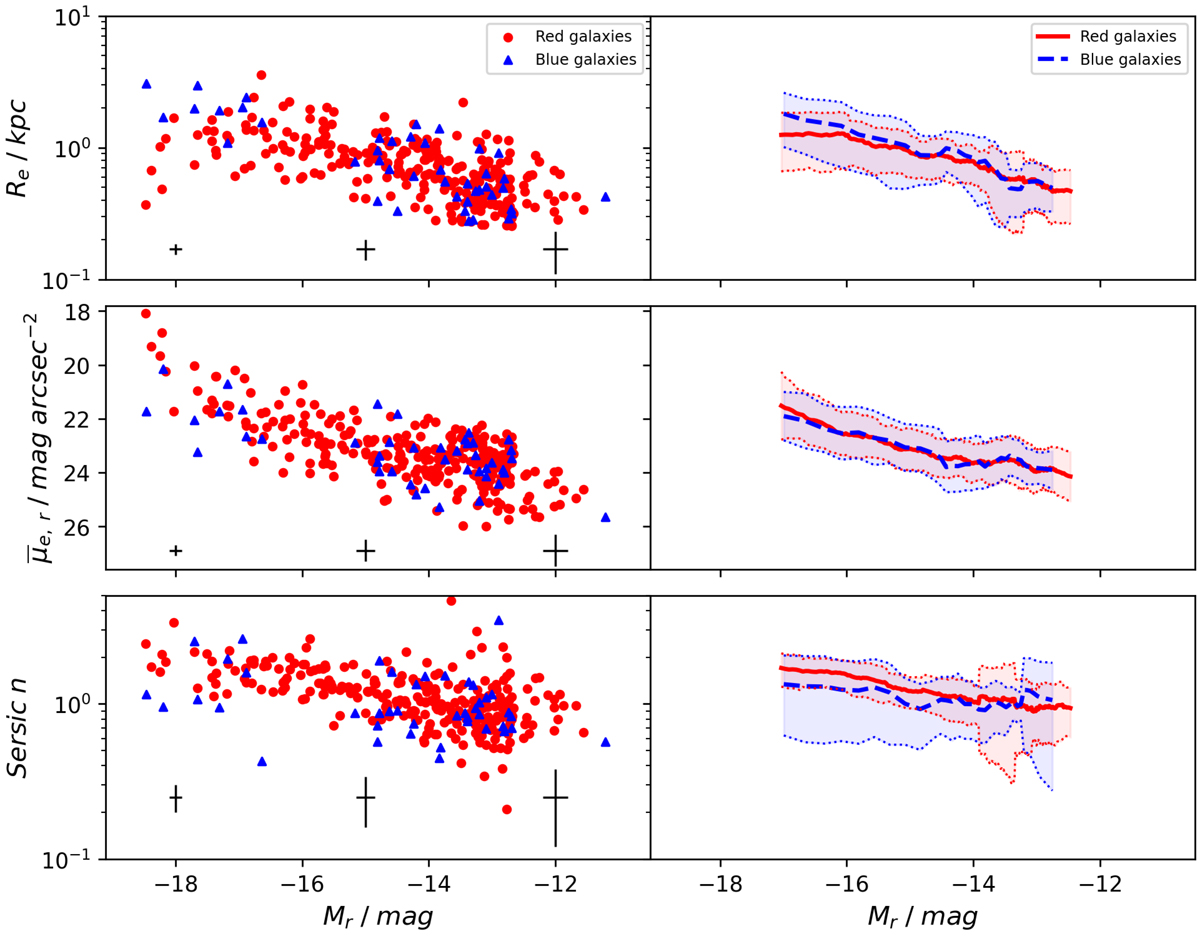
From the top to the bottom row: effective radius Re, mean effective surface brightness in r-band ![]() , and Sérsic index n of our dwarf sample, as a function of total r-band absolute magnitude Mr. Left panels: individual galaxies, right panels: running means, for both populations. We use a fixed number of elements in each bin to get the local mean, N = 40 for red dwarf population, and N = 10 for blue dwarfs. Blue triangles and dashed lines correspond to the blue population of galaxies, while the red dots and solid line are the red dwarfs. The shaded areas correspond to two standard deviations of the points using the same running mean. Effective radius and Sérsic index panels are in logarithmic scale. Average error bars are shown for different magnitudes.
, and Sérsic index n of our dwarf sample, as a function of total r-band absolute magnitude Mr. Left panels: individual galaxies, right panels: running means, for both populations. We use a fixed number of elements in each bin to get the local mean, N = 40 for red dwarf population, and N = 10 for blue dwarfs. Blue triangles and dashed lines correspond to the blue population of galaxies, while the red dots and solid line are the red dwarfs. The shaded areas correspond to two standard deviations of the points using the same running mean. Effective radius and Sérsic index panels are in logarithmic scale. Average error bars are shown for different magnitudes.
Current usage metrics show cumulative count of Article Views (full-text article views including HTML views, PDF and ePub downloads, according to the available data) and Abstracts Views on Vision4Press platform.
Data correspond to usage on the plateform after 2015. The current usage metrics is available 48-96 hours after online publication and is updated daily on week days.
Initial download of the metrics may take a while.