Fig. 11.
Download original image
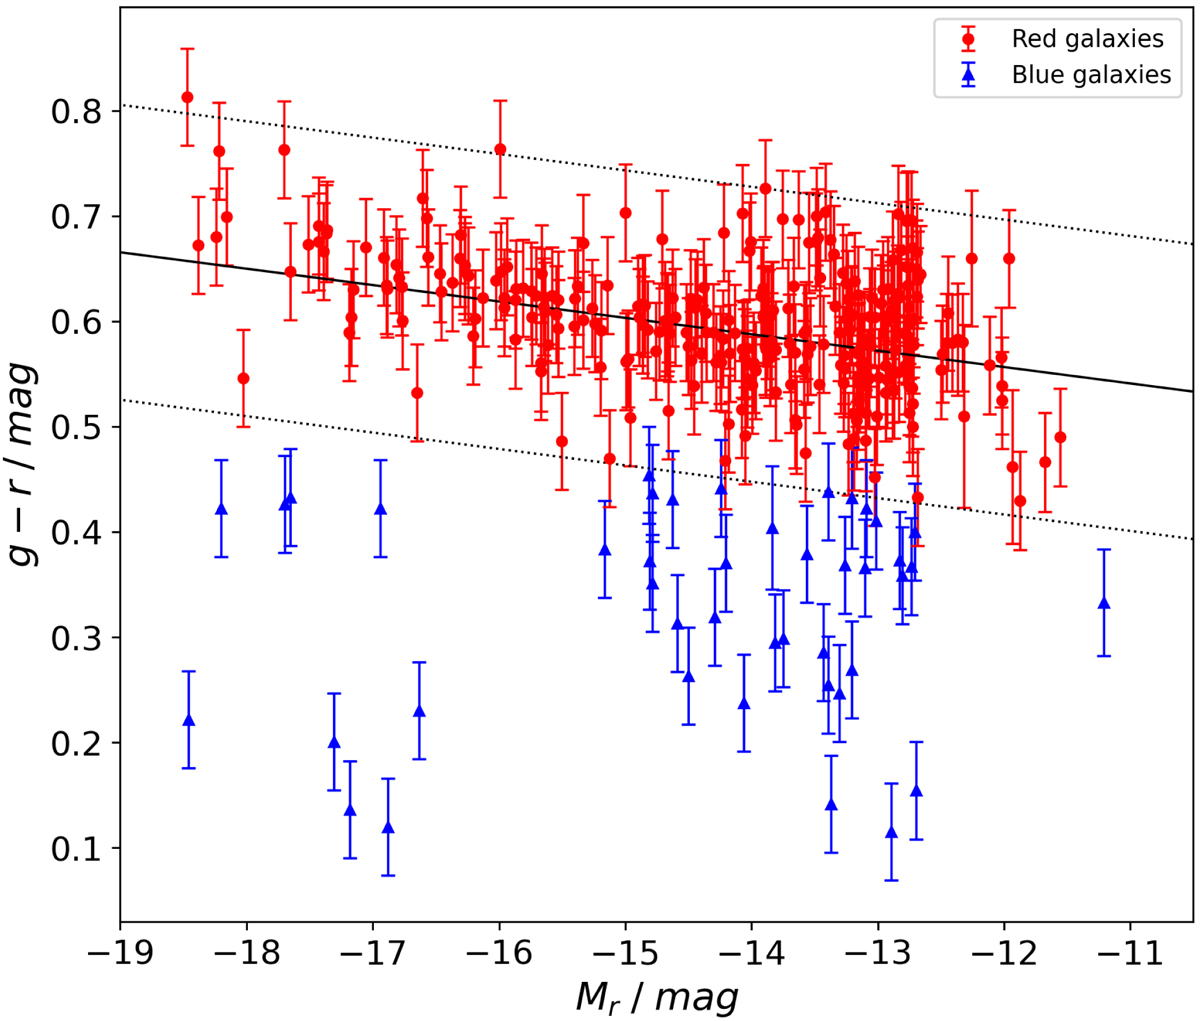
Color-magnitude relation for all Hydra I dwarf galaxies in our catalog. The solid line is the linear fit of the red sequence (Eq. (1)), while the dotted lines are the 2σ deviations from the fit. The two galaxy populations: blue triangles form the blue dwarf population, while red dots are the red dwarfs, with their color errors.
Current usage metrics show cumulative count of Article Views (full-text article views including HTML views, PDF and ePub downloads, according to the available data) and Abstracts Views on Vision4Press platform.
Data correspond to usage on the plateform after 2015. The current usage metrics is available 48-96 hours after online publication and is updated daily on week days.
Initial download of the metrics may take a while.