Free Access
Fig. 10.
Download original image
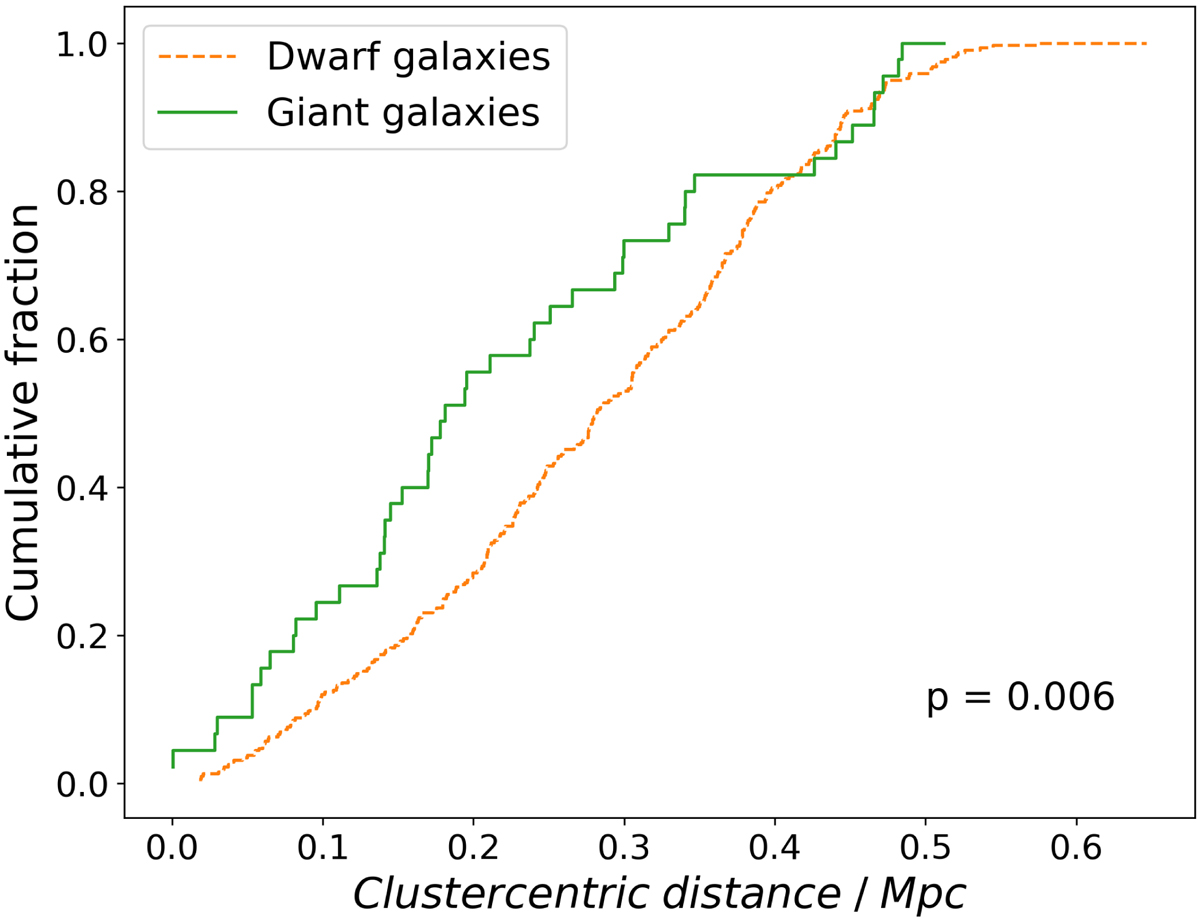
Cumulative functions of the clustercentric distances of giants (Christlein & Zabludoff 2003), green solid line, and of dwarfs, orange dashed line. The label refers to the p-value from the Kolmogorov–Smirnov test. The KS-test result states that the two radial distributions are statistically different.
Current usage metrics show cumulative count of Article Views (full-text article views including HTML views, PDF and ePub downloads, according to the available data) and Abstracts Views on Vision4Press platform.
Data correspond to usage on the plateform after 2015. The current usage metrics is available 48-96 hours after online publication and is updated daily on week days.
Initial download of the metrics may take a while.