Fig. 6.
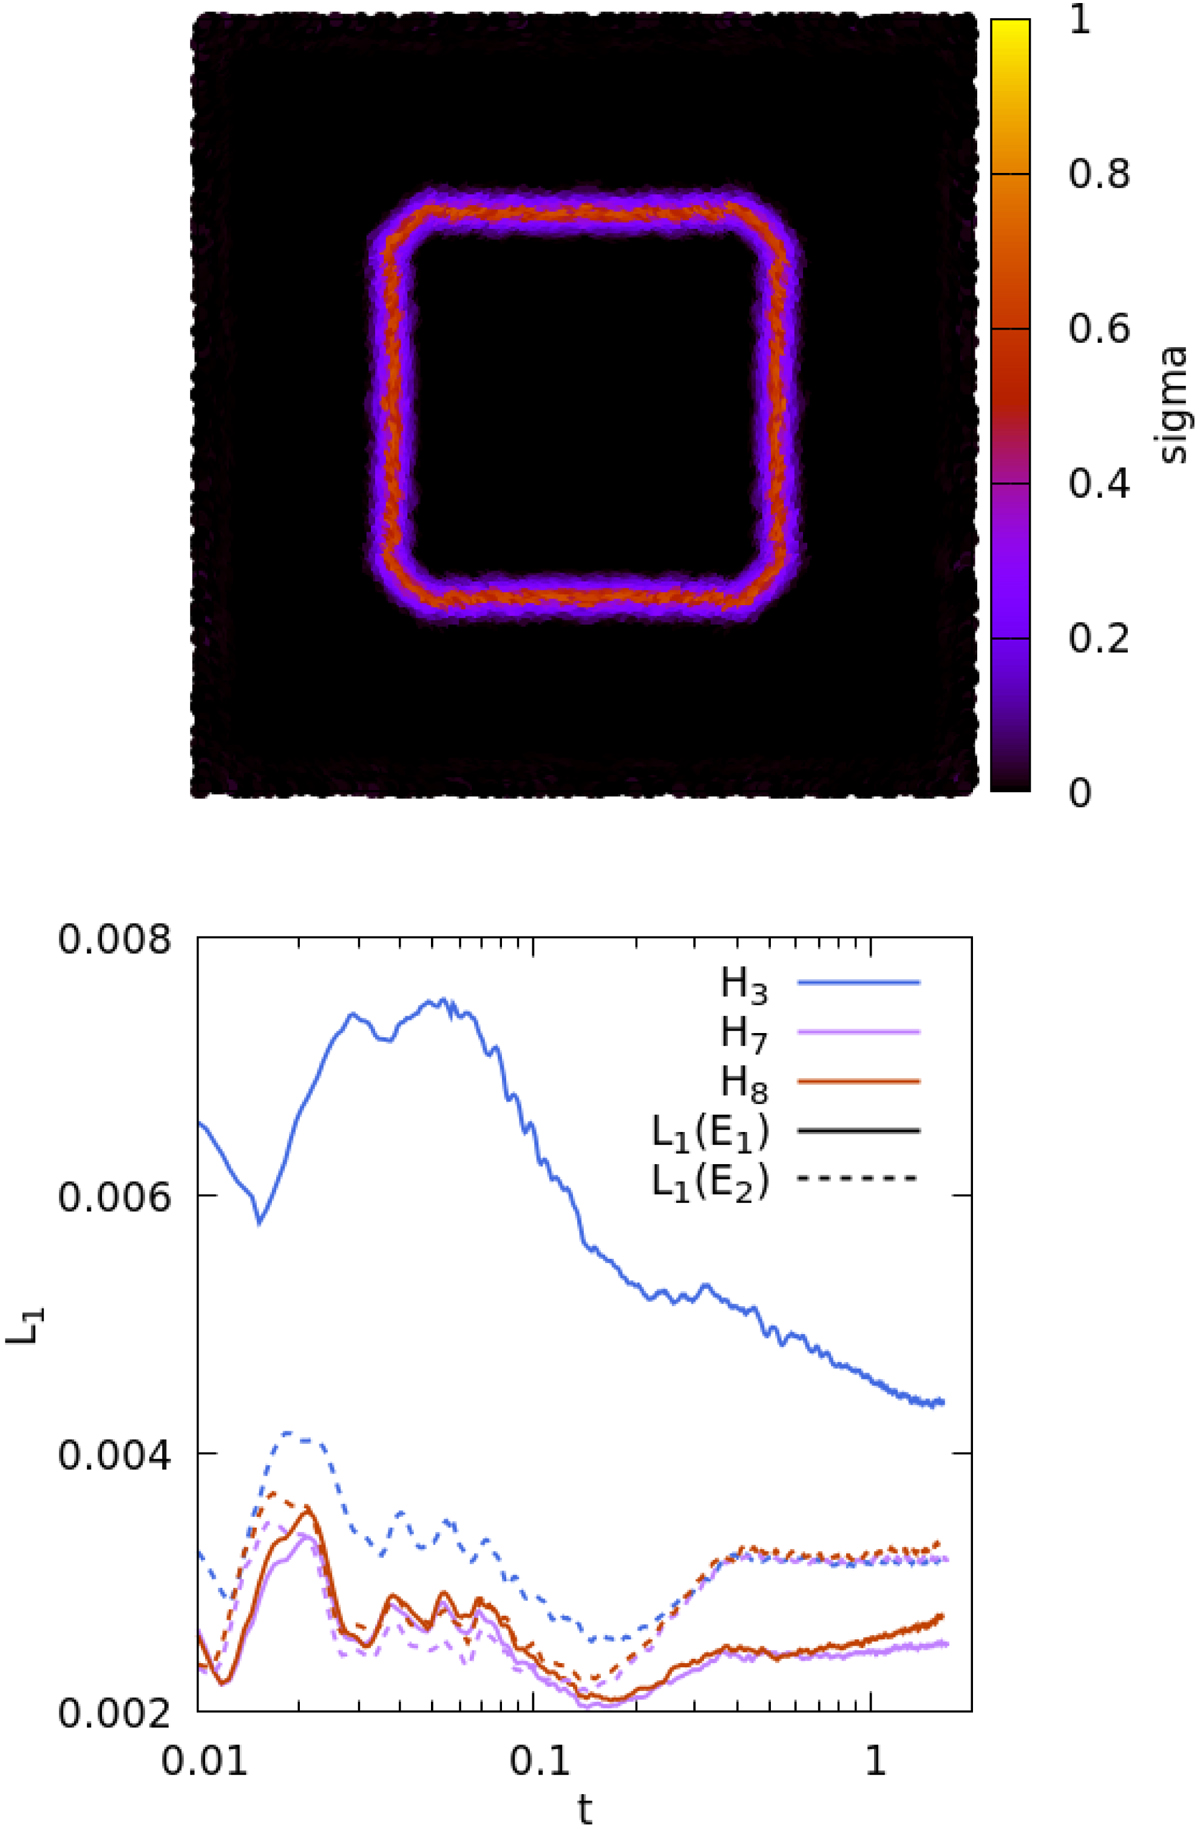
Download original image
Isobaric two-fluid numerical experiment. Upper panel: slice around Z = 0 showing the averaged σ-parameter (Eq. (37)), in model H8 at t = 0.55. Appreciable values of σ are only attained at the fluid inter-phase. Lower panel: time evolution of averaged L1(E1) (solid lines), L1(E2) (dashed lines) for models H3, H7, and H8 in Table 2.
Current usage metrics show cumulative count of Article Views (full-text article views including HTML views, PDF and ePub downloads, according to the available data) and Abstracts Views on Vision4Press platform.
Data correspond to usage on the plateform after 2015. The current usage metrics is available 48-96 hours after online publication and is updated daily on week days.
Initial download of the metrics may take a while.