Free Access
Fig. 5.
Download original image
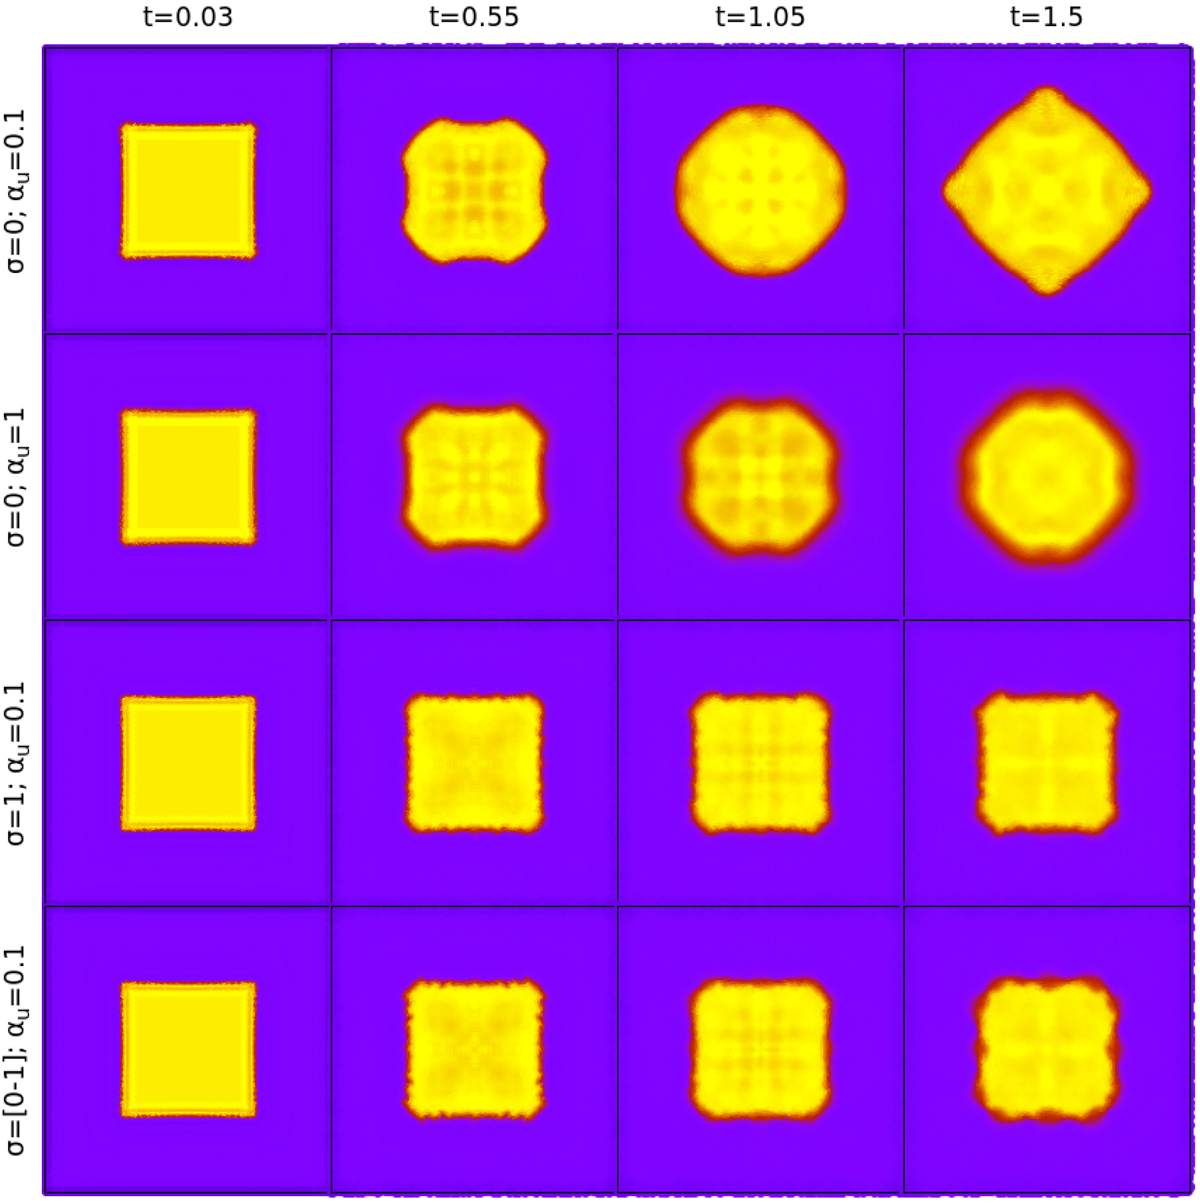
Slices around Z = 0 showing the density colormap of models H5, H6, H7, H8 (Very similar results for H1–H3 models, calculated with standard VEs can be found in plots given in previous works (Cabezón et al. 2017, their Fig. 4).) in Table 2 (rows) at different times (columns), with the sound-crossing time being τsc = 0.9.
Current usage metrics show cumulative count of Article Views (full-text article views including HTML views, PDF and ePub downloads, according to the available data) and Abstracts Views on Vision4Press platform.
Data correspond to usage on the plateform after 2015. The current usage metrics is available 48-96 hours after online publication and is updated daily on week days.
Initial download of the metrics may take a while.