Fig. 3.
Download original image
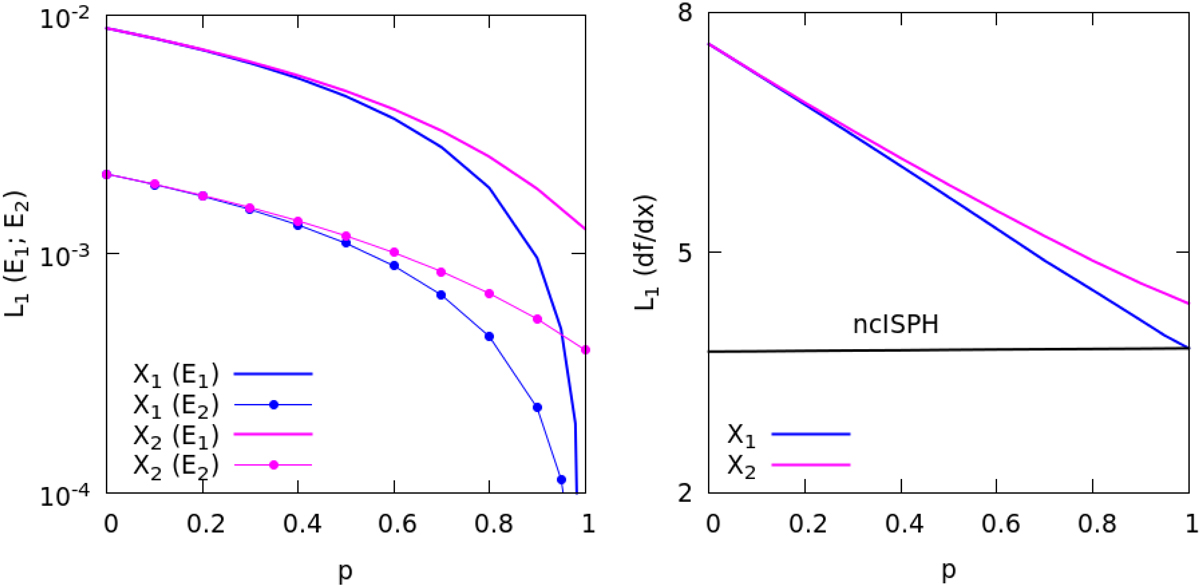
L1 calculation of the errors in the numerical experiments shown in Fig. 2. Left: averaged value of L1 for the partition of the unity (solid lines) and ⟨Δx⟩/h (dotted lines). Blue lines are for the estimator X1 and magenta lines for X2. Right: averaged value of L1, obtained with Eq. (26), for the derivative of the wall function calculated with X1 (solid blue line) and X2 (solid magenta line). The black line is the calculation with the non-conservative ISPH, which is independent of the particular value of the exponent p. We note that when p ≃ 1 both schemes (ISPH and ncISPH) converge, albeit faster for estimator X1 than for X2.
Current usage metrics show cumulative count of Article Views (full-text article views including HTML views, PDF and ePub downloads, according to the available data) and Abstracts Views on Vision4Press platform.
Data correspond to usage on the plateform after 2015. The current usage metrics is available 48-96 hours after online publication and is updated daily on week days.
Initial download of the metrics may take a while.