Fig. 16.
Download original image
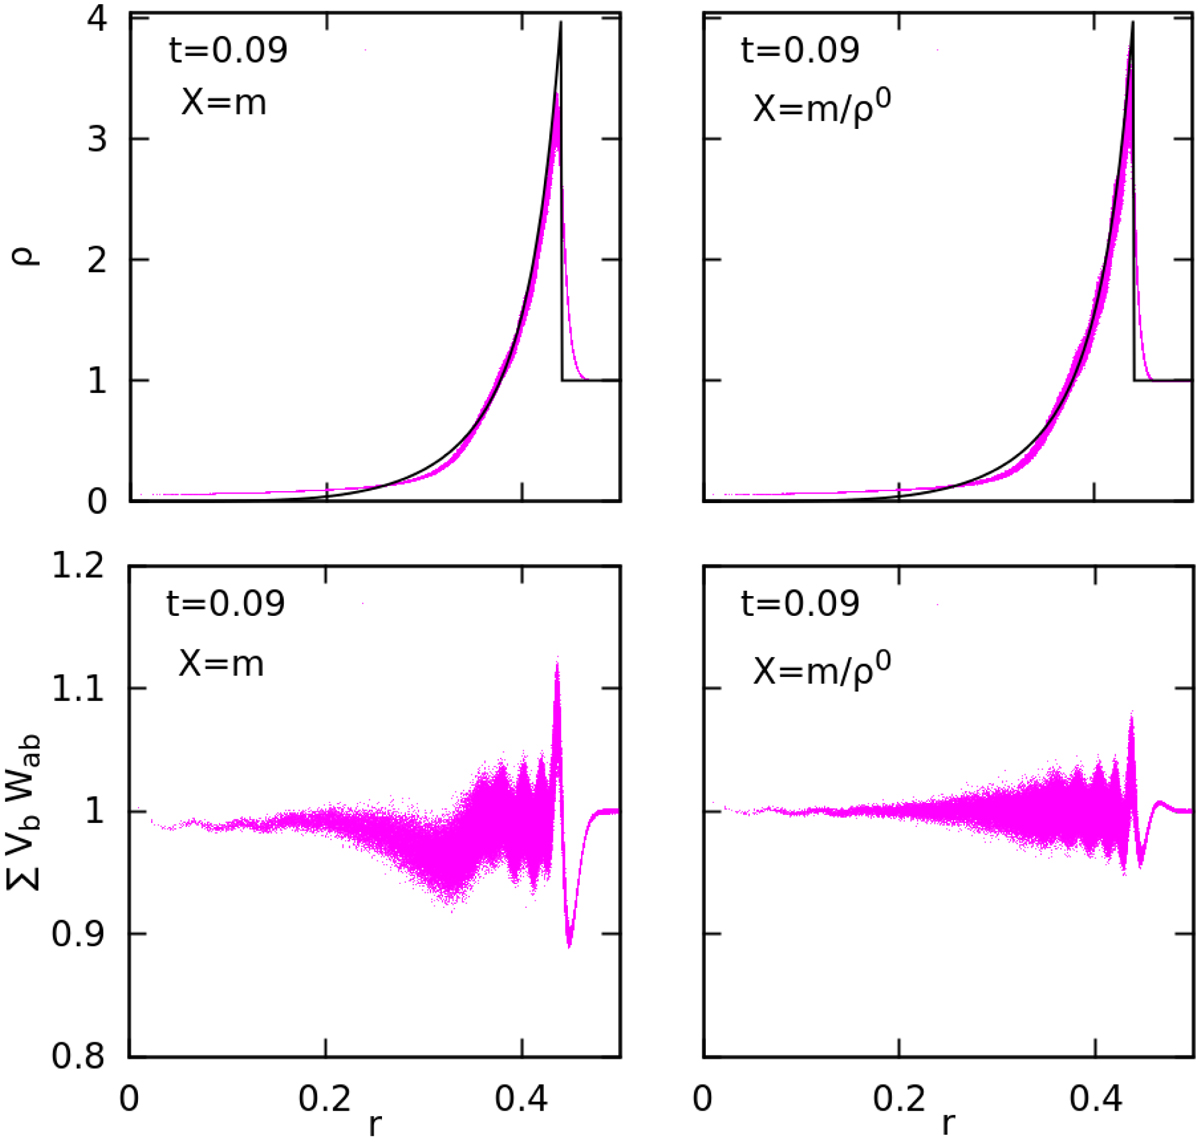
Sedov explosion for models S4 and S8 in Table 5. Top row: density profiles at t = 0.09 calculated with Xa = ma (model S4, standard VEs) and ![]() (model S8, improved VEs). The black line is the analytical solution. Note that the spherical symmetry is well preserved in both cases and that the density peak is very well reproduced with the improved VEs. Bottom row: same but with the partition of unit. All particles are represented in the plots.
(model S8, improved VEs). The black line is the analytical solution. Note that the spherical symmetry is well preserved in both cases and that the density peak is very well reproduced with the improved VEs. Bottom row: same but with the partition of unit. All particles are represented in the plots.
Current usage metrics show cumulative count of Article Views (full-text article views including HTML views, PDF and ePub downloads, according to the available data) and Abstracts Views on Vision4Press platform.
Data correspond to usage on the plateform after 2015. The current usage metrics is available 48-96 hours after online publication and is updated daily on week days.
Initial download of the metrics may take a while.