Fig. 7
Download original image
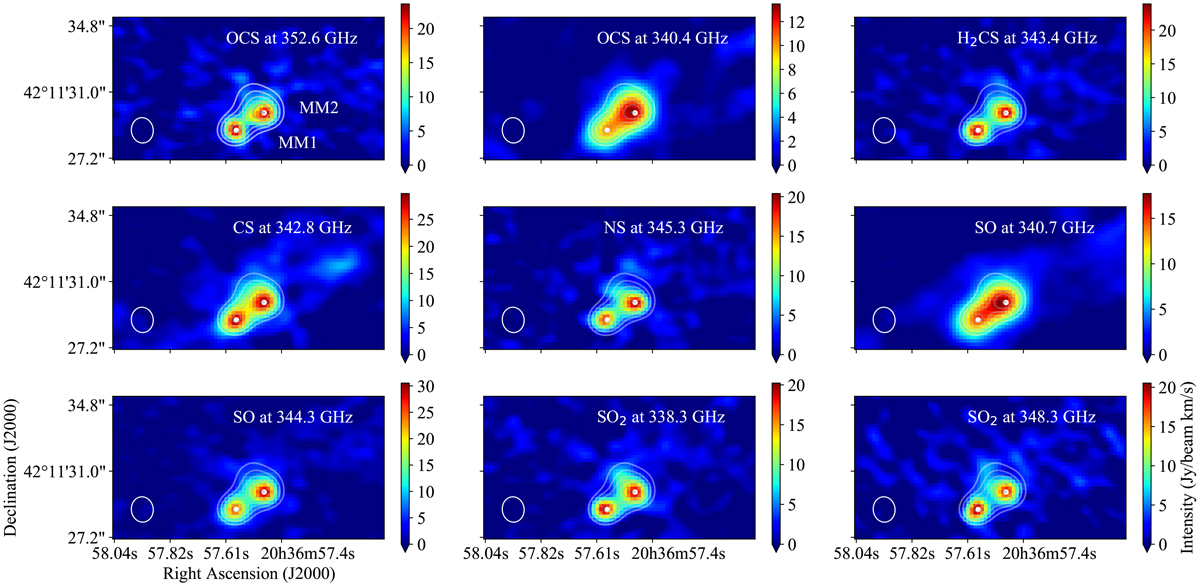
Integrated intensity maps of OCS at 352.6 and 340 GHz, CS at 342.8 and H2CS at 343.4 GHz, NS at 345.8, SO at 340.7 and at 344.3, and SO2 at 338.3 GHz and at 348.3 GHz toward Cyg X-N12. The primary binary cores of the Cyg X-N12 are denoted by MM1 and MM2 (Bontemps et al. 2010). The right arrow provides the scaling for the intensity of the observed molecule. The red area depicts intensity peaks, and the blue area represents no emission. The contours represent the continuum starting from 2 to 10σ with a spacing of 2σ. The white circle in the bottom left corner represents the beam size.
Current usage metrics show cumulative count of Article Views (full-text article views including HTML views, PDF and ePub downloads, according to the available data) and Abstracts Views on Vision4Press platform.
Data correspond to usage on the plateform after 2015. The current usage metrics is available 48-96 hours after online publication and is updated daily on week days.
Initial download of the metrics may take a while.