Free Access
Fig. 4
Download original image
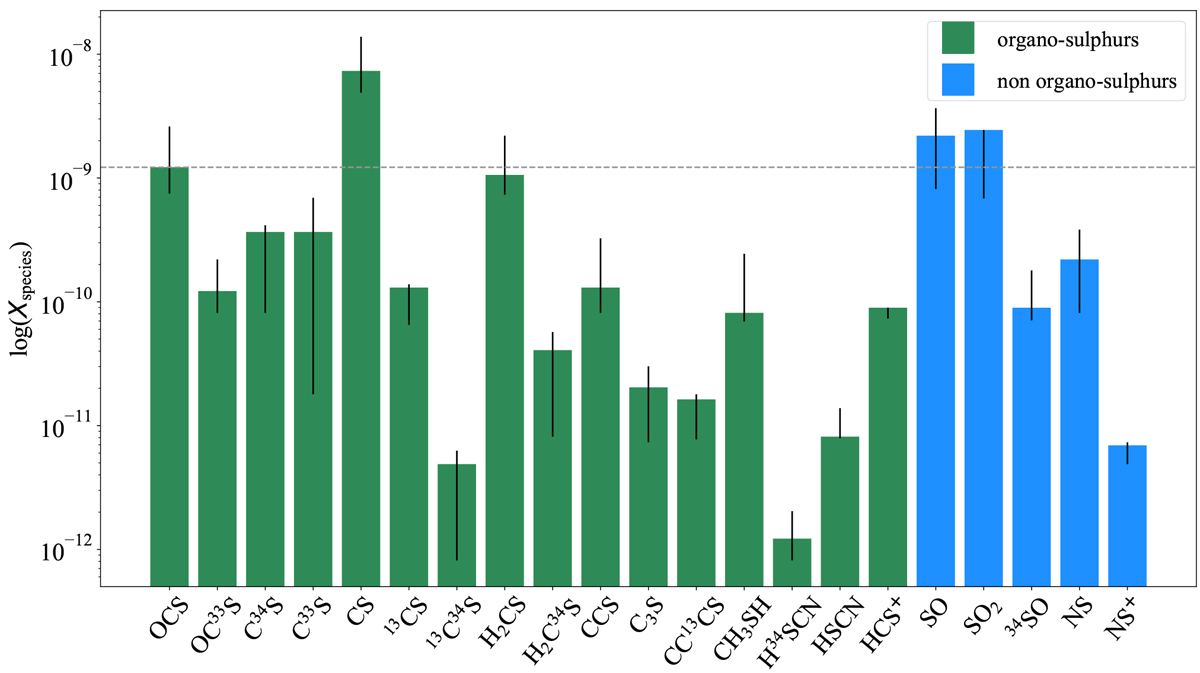
Abundance of S-species detected toward Cyg X-N12 using the derived S-abundances from Table 3 and ![]() of 1.2 × 1023 cm−2 (see text). The dotted line represents the abundance above which 20% of the sulphur sample lies.
of 1.2 × 1023 cm−2 (see text). The dotted line represents the abundance above which 20% of the sulphur sample lies.
Current usage metrics show cumulative count of Article Views (full-text article views including HTML views, PDF and ePub downloads, according to the available data) and Abstracts Views on Vision4Press platform.
Data correspond to usage on the plateform after 2015. The current usage metrics is available 48-96 hours after online publication and is updated daily on week days.
Initial download of the metrics may take a while.