Fig. 3
Download original image
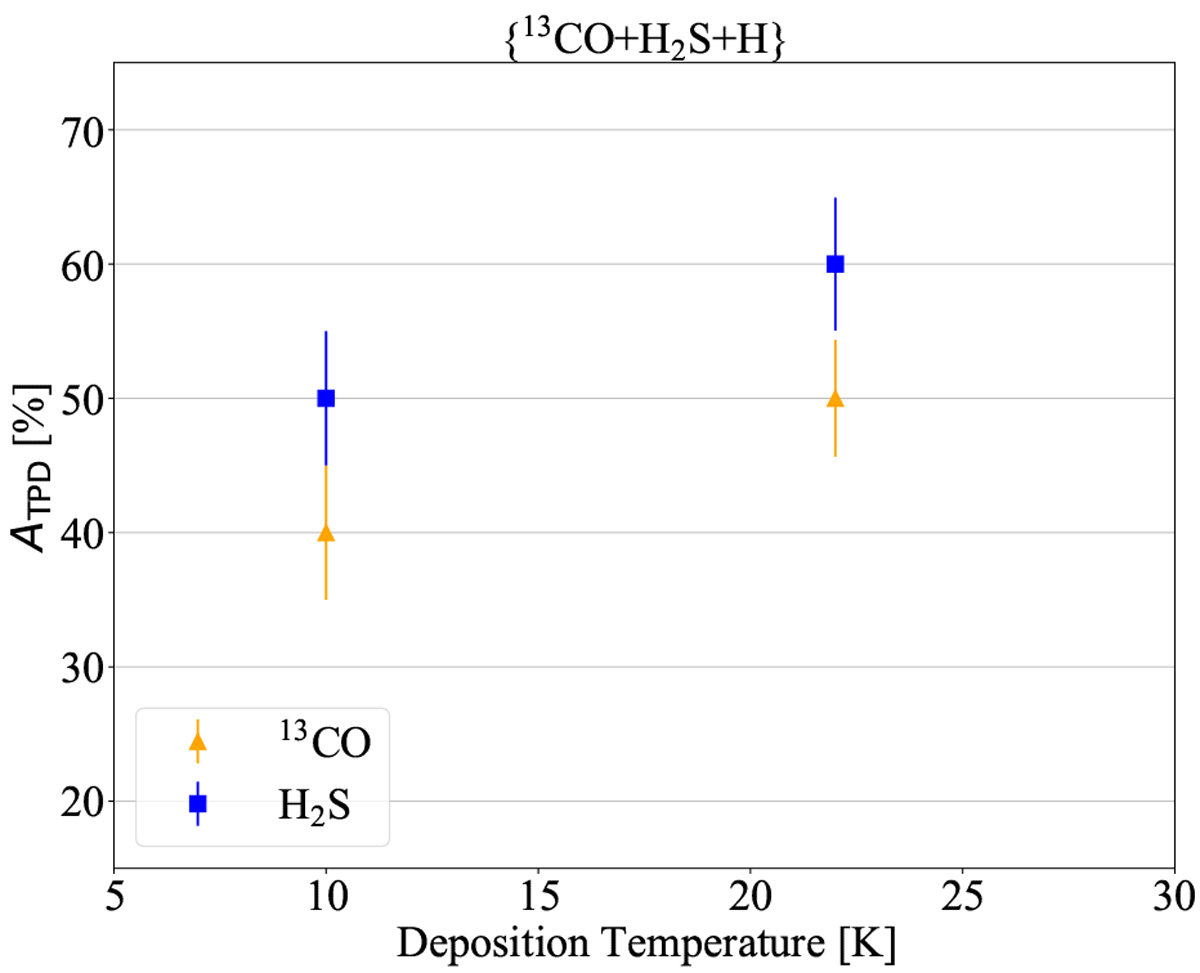
Area of m∕z = 34 (H2S, blue squares in the figure) and m∕z = 29 (13 CO, orange triangles) as a percentage of the initial amount of H2S (1.5 ML) or 13CO (1.76 ML) injected in the experiment during the reaction {H2S + 13CO +H}. The area is calculated from the QMS while performing a TPD. The temperature has been varied (10 and 22 K), while the deposition quantity was kept the same (i.e., corresponding to 15 min of injection).
Current usage metrics show cumulative count of Article Views (full-text article views including HTML views, PDF and ePub downloads, according to the available data) and Abstracts Views on Vision4Press platform.
Data correspond to usage on the plateform after 2015. The current usage metrics is available 48-96 hours after online publication and is updated daily on week days.
Initial download of the metrics may take a while.