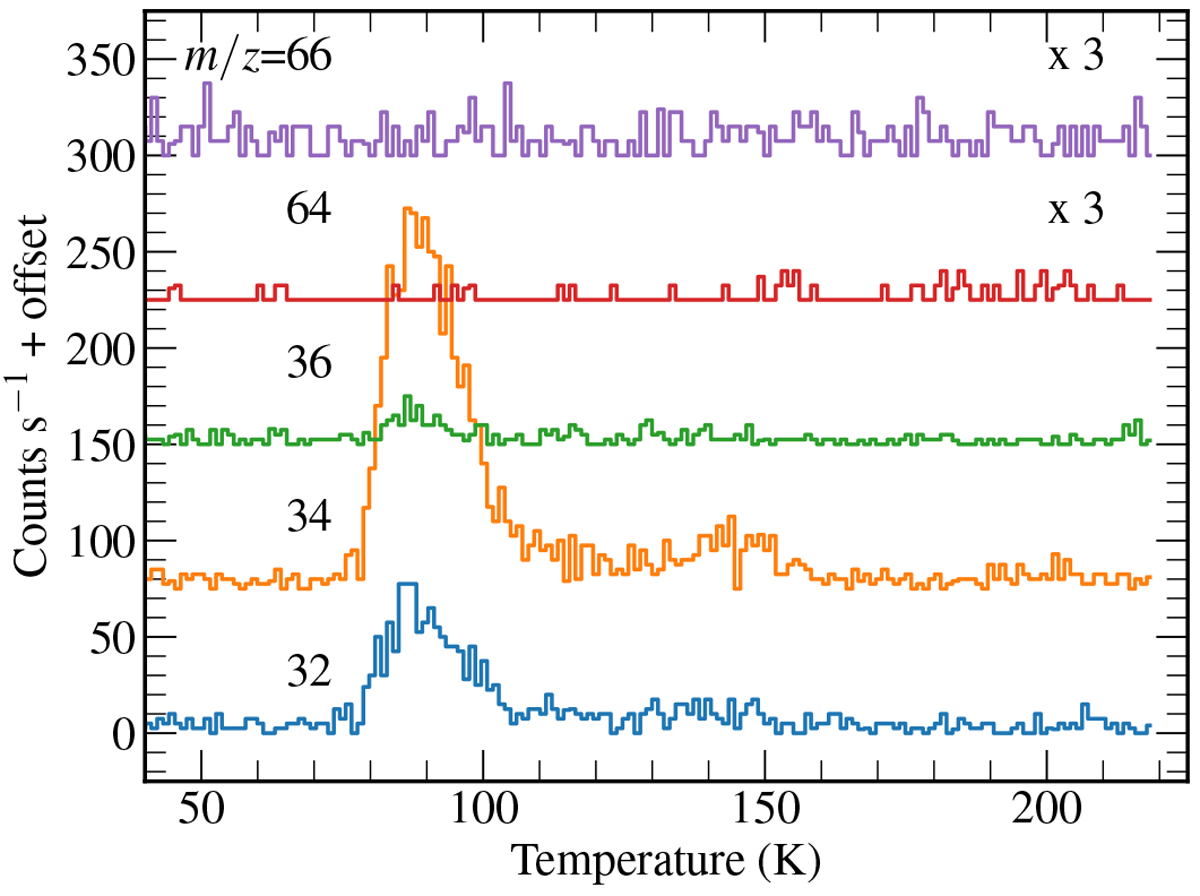
Fig. A.1
Download original image
Temperature-programmed desorption profiles obtained after hydrogenation of H2S at 10 K for 15 min. The TPD is performed from 40 K to ~220 K, and the values of m∕z are shown for each spectrum (see the main text for the species to which they correspond). The spectra have been rebinned by a factor of 4 for clarity, and are offset from one another by 80 counts s−1.
Current usage metrics show cumulative count of Article Views (full-text article views including HTML views, PDF and ePub downloads, according to the available data) and Abstracts Views on Vision4Press platform.
Data correspond to usage on the plateform after 2015. The current usage metrics is available 48-96 hours after online publication and is updated daily on week days.
Initial download of the metrics may take a while.