Fig. 9
Download original image
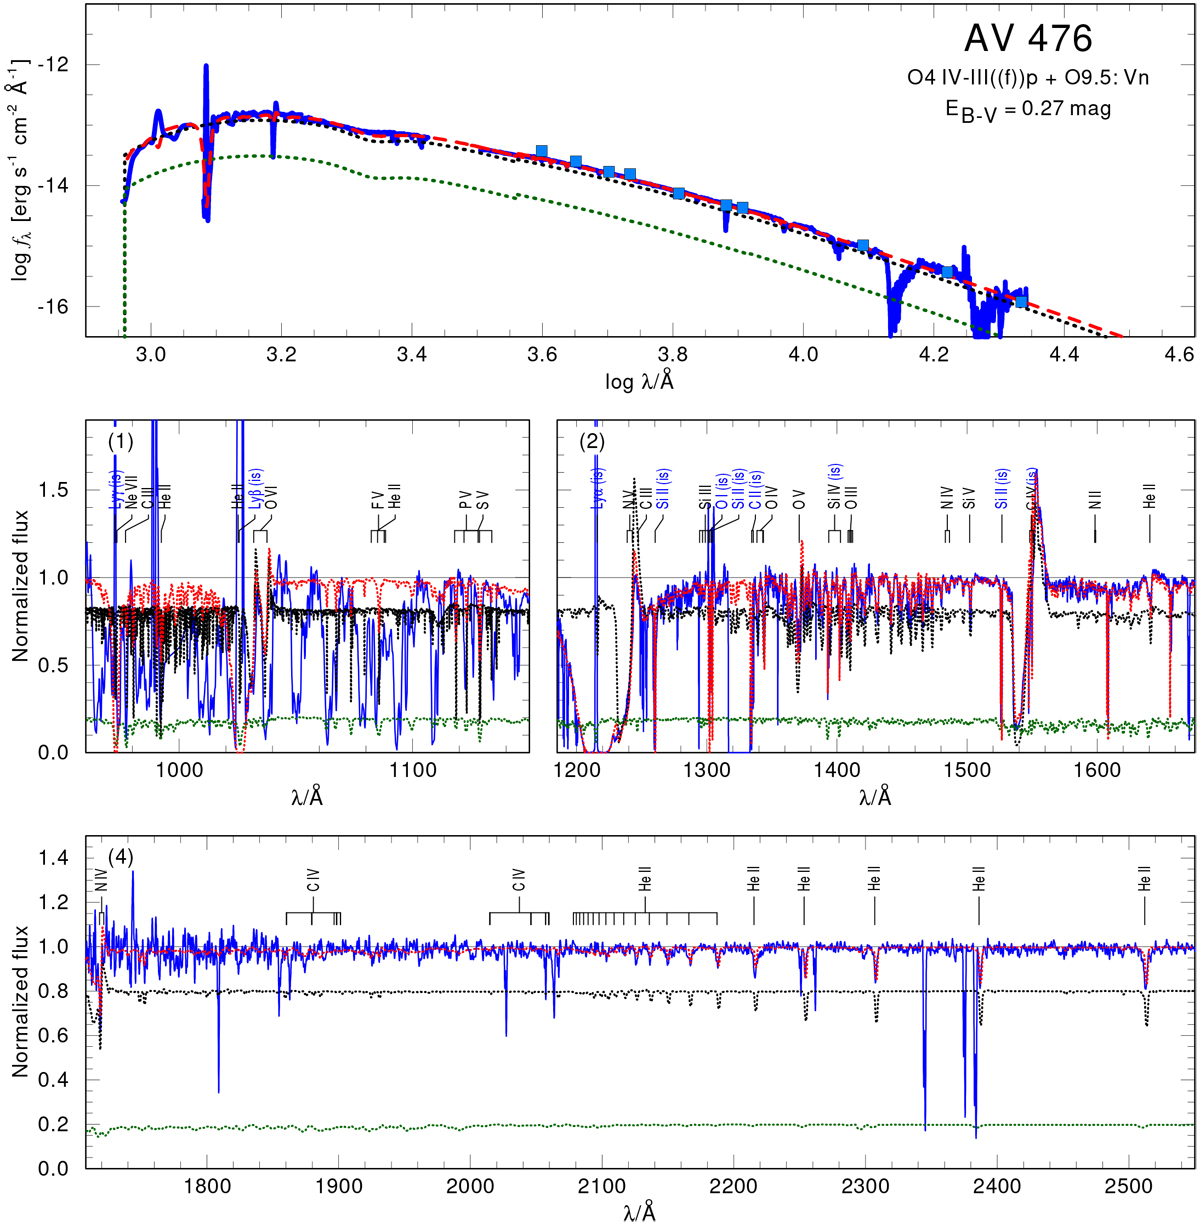
Spectral fit for AzV 476. Top panel: SED. Flux-calibrated observations (blue lines) are the FUSE (1), COS (2), STIS (4), and X-shooter (5) spectra as listed in Table 1. The light blue squares are the photometric UBVRIJHK data as listed in Table 2. The model SED composed of both stellar components is shown as a dashed red line, while the individual SEDs of the primary and the secondary are shown as dotted black and green lines, respectively.Lower panels: normalized FUSE (1), COS (2), and STIS (4) spectra. The number in the upper left corner corresponds to the ID given to a specific spectrum as listed in Table 1. The line styles are the same as in the top panel. The synthetic spectra are calculated with the model parameters compiled in Table 6 (“Spectroscopy” columns).
Current usage metrics show cumulative count of Article Views (full-text article views including HTML views, PDF and ePub downloads, according to the available data) and Abstracts Views on Vision4Press platform.
Data correspond to usage on the plateform after 2015. The current usage metrics is available 48-96 hours after online publication and is updated daily on week days.
Initial download of the metrics may take a while.